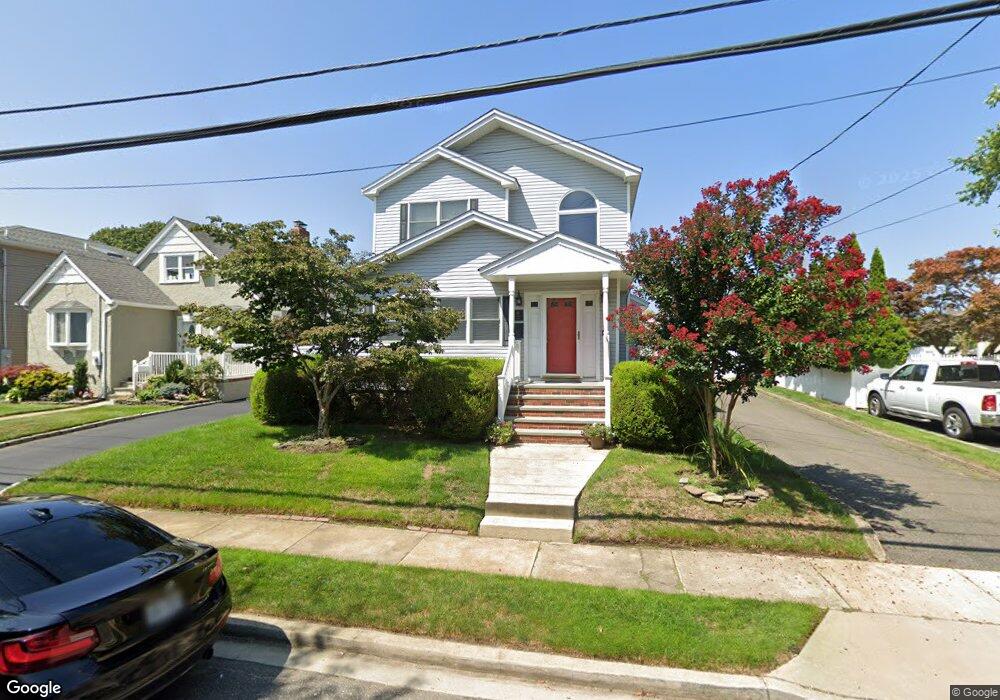
49 Orchard St Massapequa, NY 11758
Estimated Value: $745,635 - $874,000
--
Bed
1
Bath
2,105
Sq Ft
$385/Sq Ft
Est. Value
About This Home
This home is located at 49 Orchard St, Massapequa, NY 11758 and is currently estimated at $809,818, approximately $384 per square foot. 49 Orchard St is a home located in Nassau County with nearby schools including Massapequa High School - Ames Campus, Berner Middle School, and Massapequa High School.
Ownership History
Date
Name
Owned For
Owner Type
Purchase Details
Closed on
Aug 31, 2001
Current Estimated Value
Create a Home Valuation Report for This Property
The Home Valuation Report is an in-depth analysis detailing your home's value as well as a comparison with similar homes in the area
Home Values in the Area
Average Home Value in this Area
Purchase History
| Date | Buyer | Sale Price | Title Company |
|---|---|---|---|
| -- | -- | -- |
Source: Public Records
Tax History Compared to Growth
Tax History
| Year | Tax Paid | Tax Assessment Tax Assessment Total Assessment is a certain percentage of the fair market value that is determined by local assessors to be the total taxable value of land and additions on the property. | Land | Improvement |
|---|---|---|---|---|
| 2025 | $13,477 | $473 | $132 | $341 |
| 2024 | $3,932 | $473 | $132 | $341 |
| 2023 | $11,204 | $493 | $138 | $355 |
| 2022 | $11,204 | $493 | $138 | $355 |
| 2021 | $10,472 | $505 | $142 | $363 |
| 2020 | $10,597 | $601 | $553 | $48 |
| 2019 | $9,379 | $644 | $556 | $88 |
| 2018 | $9,337 | $687 | $0 | $0 |
| 2017 | $5,868 | $730 | $560 | $170 |
| 2016 | $9,419 | $773 | $534 | $239 |
| 2015 | $3,563 | $816 | $512 | $304 |
| 2014 | $3,563 | $816 | $512 | $304 |
| 2013 | $3,411 | $859 | $539 | $320 |
Source: Public Records
Map
Nearby Homes
- 5675 Merrick Rd
- 54 Chestnut St
- 17 Linden St
- 243 Seaford Ave
- 230 W End Ave
- 28 Grove St
- 138 Saint Marks Place
- 135 Ocean Ave
- 4 Sutton Place
- 94 Alhambra Rd
- 344 Harrison Ave
- 3937 John Ln
- 3969 Marlow Ct
- 3945 Hickory St
- 5 Canal Rd
- 2067 Jackson Ave
- 43 Seabreeze Rd
- 37 Lakeshore Blvd
- 3861 Hickory St
- 3875 South St