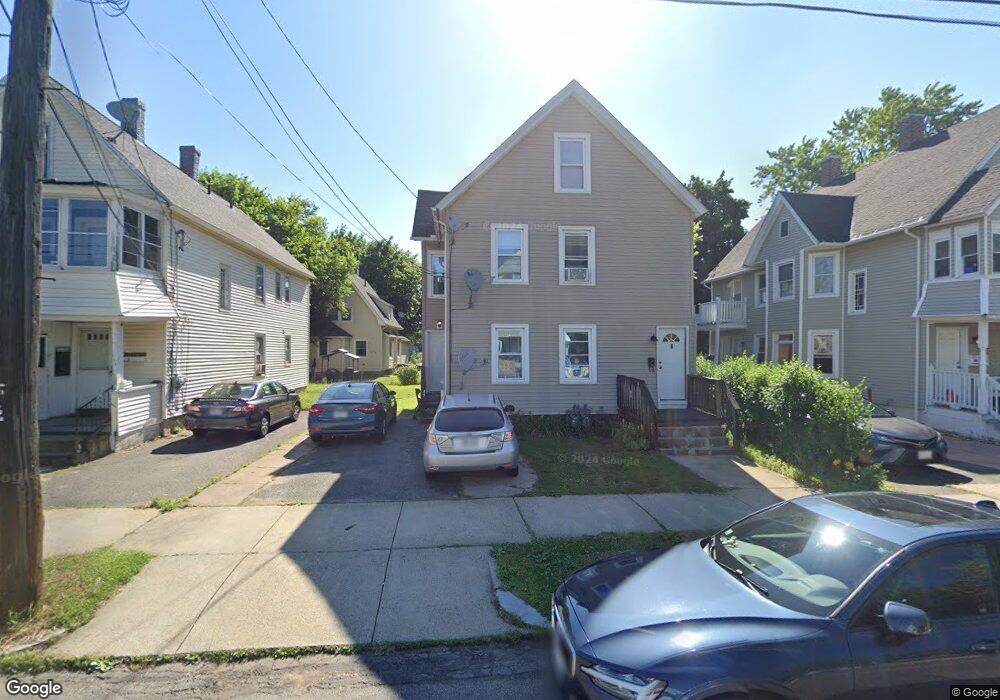
49 Pasco Rd Indian Orchard, MA 01151
Indian Orchard NeighborhoodEstimated Value: $278,000 - $340,000
4
Beds
2
Baths
1,844
Sq Ft
$167/Sq Ft
Est. Value
About This Home
This home is located at 49 Pasco Rd, Indian Orchard, MA 01151 and is currently estimated at $307,119, approximately $166 per square foot. 49 Pasco Rd is a home located in Hampden County with nearby schools including Indian Orchard Elementary School, John F. Kennedy Academy, and Roger L. Putnam Vocational Technical Academy.
Ownership History
Date
Name
Owned For
Owner Type
Purchase Details
Closed on
Aug 20, 1987
Sold by
Santos Jose
Bought by
Reidy John
Current Estimated Value
Home Financials for this Owner
Home Financials are based on the most recent Mortgage that was taken out on this home.
Original Mortgage
$93,600
Interest Rate
10.29%
Mortgage Type
Purchase Money Mortgage
Create a Home Valuation Report for This Property
The Home Valuation Report is an in-depth analysis detailing your home's value as well as a comparison with similar homes in the area
Home Values in the Area
Average Home Value in this Area
Purchase History
| Date | Buyer | Sale Price | Title Company |
|---|---|---|---|
| Reidy John | $104,000 | -- |
Source: Public Records
Mortgage History
| Date | Status | Borrower | Loan Amount |
|---|---|---|---|
| Closed | Reidy John | $7,100 | |
| Closed | Reidy John | $93,600 | |
| Closed | Reidy John | $50,000 |
Source: Public Records
Tax History Compared to Growth
Tax History
| Year | Tax Paid | Tax Assessment Tax Assessment Total Assessment is a certain percentage of the fair market value that is determined by local assessors to be the total taxable value of land and additions on the property. | Land | Improvement |
|---|---|---|---|---|
| 2025 | $3,765 | $240,100 | $40,400 | $199,700 |
| 2024 | $3,334 | $207,600 | $37,700 | $169,900 |
| 2023 | $2,856 | $167,500 | $30,900 | $136,600 |
| 2022 | $2,825 | $150,100 | $28,900 | $121,200 |
| 2021 | $2,877 | $152,200 | $26,300 | $125,900 |
| 2020 | $2,773 | $142,000 | $26,300 | $115,700 |
| 2019 | $2,728 | $138,600 | $27,200 | $111,400 |
| 2018 | $2,653 | $134,800 | $27,200 | $107,600 |
| 2017 | $2,418 | $123,000 | $23,100 | $99,900 |
| 2016 | $2,078 | $105,700 | $23,100 | $82,600 |
| 2015 | $2,000 | $101,700 | $23,100 | $78,600 |
Source: Public Records
Map
Nearby Homes