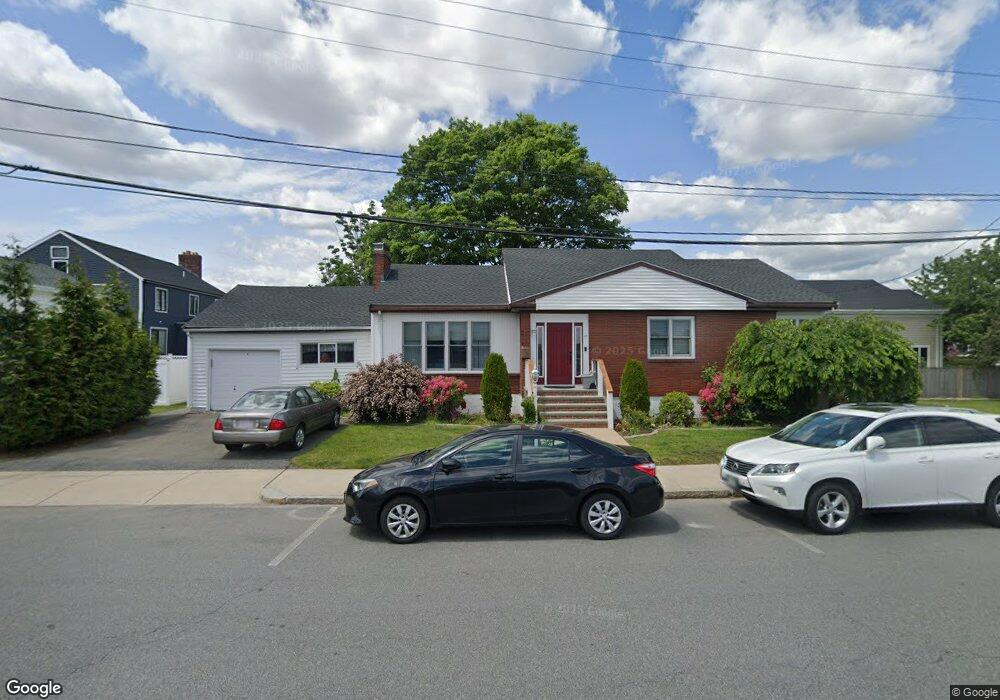
49 Payson St Winthrop, MA 02152
Downtown Winthrop NeighborhoodEstimated Value: $769,000 - $899,834
5
Beds
3
Baths
2,272
Sq Ft
$367/Sq Ft
Est. Value
About This Home
This home is located at 49 Payson St, Winthrop, MA 02152 and is currently estimated at $834,209, approximately $367 per square foot. 49 Payson St is a home located in Suffolk County with nearby schools including William P. Gorman/Fort Banks Elementary School, Arthur T. Cummings Elementary School, and Winthrop Middle School.
Ownership History
Date
Name
Owned For
Owner Type
Purchase Details
Closed on
Dec 28, 2015
Sold by
Raney Sande G and Raney Ralph E
Bought by
Raney Ralph E and Raney Sande G
Current Estimated Value
Home Financials for this Owner
Home Financials are based on the most recent Mortgage that was taken out on this home.
Original Mortgage
$190,000
Outstanding Balance
$80,845
Interest Rate
3.99%
Mortgage Type
New Conventional
Estimated Equity
$753,364
Purchase Details
Closed on
Nov 4, 2014
Sold by
Fitzgerald Barbara L
Bought by
Raney Ralph E and Raney Sande G
Create a Home Valuation Report for This Property
The Home Valuation Report is an in-depth analysis detailing your home's value as well as a comparison with similar homes in the area
Home Values in the Area
Average Home Value in this Area
Purchase History
| Date | Buyer | Sale Price | Title Company |
|---|---|---|---|
| Raney Ralph E | -- | -- | |
| Raney Ralph E | -- | -- |
Source: Public Records
Mortgage History
| Date | Status | Borrower | Loan Amount |
|---|---|---|---|
| Open | Raney Ralph E | $190,000 |
Source: Public Records
Tax History
| Year | Tax Paid | Tax Assessment Tax Assessment Total Assessment is a certain percentage of the fair market value that is determined by local assessors to be the total taxable value of land and additions on the property. | Land | Improvement |
|---|---|---|---|---|
| 2025 | $8,764 | $849,200 | $353,800 | $495,400 |
| 2024 | $8,841 | $848,500 | $340,100 | $508,400 |
| 2023 | $8,069 | $754,100 | $311,300 | $442,800 |
| 2022 | $8,958 | $761,700 | $277,600 | $484,100 |
| 2021 | $8,778 | $692,300 | $247,900 | $444,400 |
| 2020 | $8,004 | $634,200 | $247,900 | $386,300 |
| 2019 | $7,701 | $584,300 | $228,500 | $355,800 |
| 2018 | $7,598 | $536,600 | $196,100 | $340,500 |
| 2017 | $7,055 | $489,600 | $173,600 | $316,000 |
| 2016 | $6,757 | $439,600 | $151,000 | $288,600 |
| 2015 | $5,905 | $411,800 | $146,600 | $265,200 |
| 2014 | $6,165 | $395,700 | $136,300 | $259,400 |
Source: Public Records
Map
Nearby Homes
- 426 Winthrop St
- 441 Winthrop St
- 100 Governors Dr Unit 118
- 800 Governors Dr Unit 6
- 140 Shirley St Unit 201
- 140 Shirley St Unit 309
- 140 Shirley St Unit 310
- 140 Shirley St Unit 204
- 130 Shirley St Unit 202
- 50-52 Wilshire St
- 43 Sagamore Ave Unit 1
- 279 Shirley St Unit 2
- 203 Winthrop Shore Dr Unit 2
- 53 Trident Ave Unit 204
- 37 Trident Ave
- 47 Highland Ave
- 14 Pleasant Park Rd
- 10 Somerset Ave Unit 403
- 10 Somerset Ave Unit 404
- 10 Somerset Ave Unit 401
- 45 Franklin St
- 57 Payson St
- 26 Central St
- 24 Central St
- 40 Harvard St
- 34 Harvard St
- 46 Franklin St
- 46 Franklin St Unit B
- 22 Central St
- 28 Harvard St
- 56 Franklin St
- 56 Franklin St (Fka 45)
- 20 Harvard St Unit 22
- 57 Central St
- 51 Central St
- 45 Central St
- 43 Franklin St
- 12 Harvard St Unit 1
- 12 Harvard St Unit 2
- 12 Harvard St
Your Personal Tour Guide
Ask me questions while you tour the home.