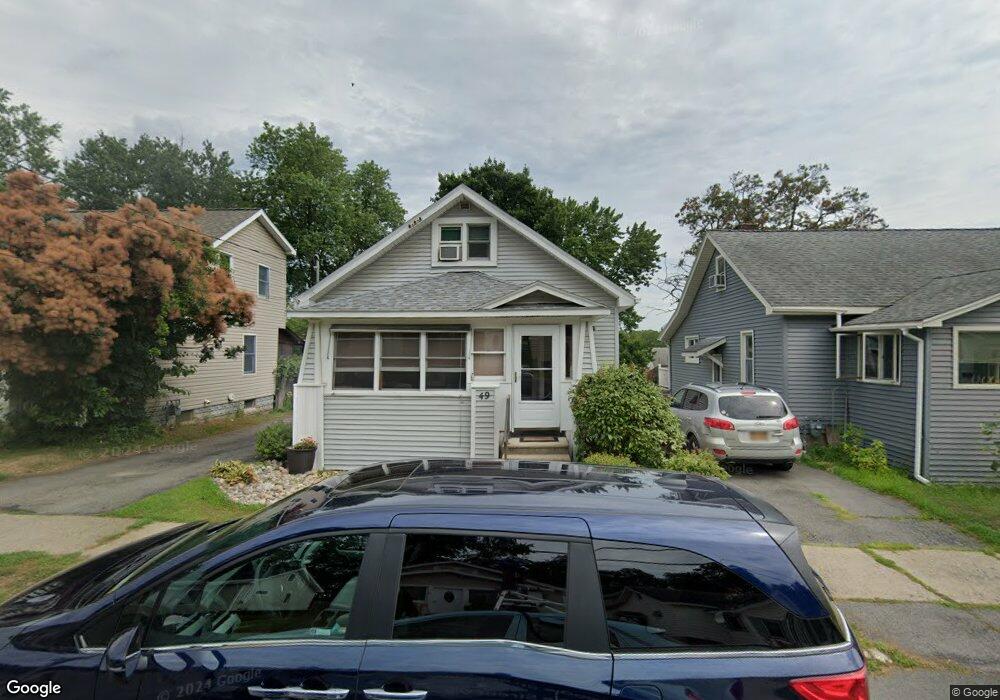
49 Pershing Dr Schenectady, NY 12302
Estimated Value: $213,417 - $260,000
3
Beds
1
Bath
1,280
Sq Ft
$181/Sq Ft
Est. Value
About This Home
This home is located at 49 Pershing Dr, Schenectady, NY 12302 and is currently estimated at $231,604, approximately $180 per square foot. 49 Pershing Dr is a home located in Schenectady County with nearby schools including Scotia Glenville Senior High School and Mekeel Christian Academy.
Ownership History
Date
Name
Owned For
Owner Type
Purchase Details
Closed on
May 21, 2008
Sold by
Tierman Jeffrey
Bought by
Hecker Er2c E
Current Estimated Value
Home Financials for this Owner
Home Financials are based on the most recent Mortgage that was taken out on this home.
Original Mortgage
$138,902
Outstanding Balance
$87,320
Interest Rate
5.91%
Mortgage Type
FHA
Estimated Equity
$144,284
Purchase Details
Closed on
Jun 29, 2004
Sold by
Meade Robert A Kay E
Bought by
Tiernan Jeffery
Purchase Details
Closed on
Nov 29, 1996
Sold by
Quinn
Bought by
Meade Kay E and Meade Robert A
Purchase Details
Closed on
Oct 1, 1996
Create a Home Valuation Report for This Property
The Home Valuation Report is an in-depth analysis detailing your home's value as well as a comparison with similar homes in the area
Home Values in the Area
Average Home Value in this Area
Purchase History
| Date | Buyer | Sale Price | Title Company |
|---|---|---|---|
| Hecker Er2c E | $144,900 | Charles Dumas | |
| Tiernan Jeffery | $87,000 | Jack Overton | |
| Meade Kay E | $74,000 | -- | |
| -- | $27,000 | -- |
Source: Public Records
Mortgage History
| Date | Status | Borrower | Loan Amount |
|---|---|---|---|
| Open | Hecker Er2c E | $138,902 |
Source: Public Records
Tax History
| Year | Tax Paid | Tax Assessment Tax Assessment Total Assessment is a certain percentage of the fair market value that is determined by local assessors to be the total taxable value of land and additions on the property. | Land | Improvement |
|---|---|---|---|---|
| 2024 | $4,869 | $95,500 | $16,000 | $79,500 |
| 2023 | $42 | $95,500 | $16,000 | $79,500 |
| 2022 | $4,552 | $95,500 | $16,000 | $79,500 |
| 2021 | $4,481 | $95,500 | $16,000 | $79,500 |
| 2020 | $3,874 | $95,500 | $16,000 | $79,500 |
| 2019 | $1,255 | $95,500 | $16,000 | $79,500 |
| 2018 | $3,638 | $95,500 | $16,000 | $79,500 |
| 2017 | $3,516 | $95,500 | $16,000 | $79,500 |
| 2016 | $3,509 | $95,500 | $16,000 | $79,500 |
| 2015 | -- | $95,500 | $16,000 | $79,500 |
| 2014 | -- | $95,500 | $16,000 | $79,500 |
Source: Public Records
Map
Nearby Homes
Your Personal Tour Guide
Ask me questions while you tour the home.