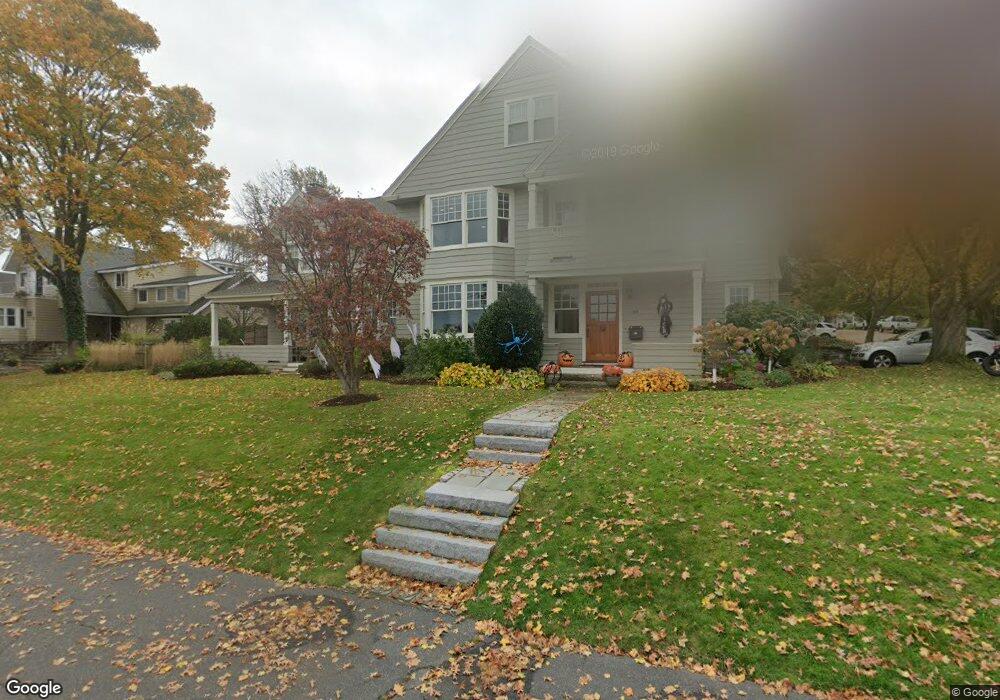
49 Phillips St Marblehead, MA 01945
Estimated Value: $1,962,000 - $2,836,000
4
Beds
4
Baths
3,897
Sq Ft
$640/Sq Ft
Est. Value
About This Home
This home is located at 49 Phillips St, Marblehead, MA 01945 and is currently estimated at $2,493,255, approximately $639 per square foot. 49 Phillips St is a home located in Essex County with nearby schools including Marblehead High School, Devereux School, and Tower School.
Ownership History
Date
Name
Owned For
Owner Type
Purchase Details
Closed on
Apr 27, 2021
Sold by
Williamson Jennifer T
Bought by
Jennifer T Williamson Lt and Williamson
Current Estimated Value
Purchase Details
Closed on
Jun 18, 2012
Sold by
Williamson Brian W and Willaimson Jennifer T
Bought by
Williamson Jennifer T
Purchase Details
Closed on
Sep 21, 2004
Sold by
Stanton Kathleen M and Stanton Paul F
Bought by
Williamson Brian W and Williamson Jennifer T
Create a Home Valuation Report for This Property
The Home Valuation Report is an in-depth analysis detailing your home's value as well as a comparison with similar homes in the area
Home Values in the Area
Average Home Value in this Area
Purchase History
| Date | Buyer | Sale Price | Title Company |
|---|---|---|---|
| Jennifer T Williamson Lt | -- | None Available | |
| Williamson Jennifer T | -- | -- | |
| Williamson Jennifer T | -- | -- | |
| Williamson Brian W | -- | -- | |
| Williamson Brian W | -- | -- |
Source: Public Records
Mortgage History
| Date | Status | Borrower | Loan Amount |
|---|---|---|---|
| Previous Owner | Williamson Brian W | $375,000 |
Source: Public Records
Tax History
| Year | Tax Paid | Tax Assessment Tax Assessment Total Assessment is a certain percentage of the fair market value that is determined by local assessors to be the total taxable value of land and additions on the property. | Land | Improvement |
|---|---|---|---|---|
| 2025 | $18,997 | $2,099,100 | $937,300 | $1,161,800 |
| 2024 | $19,687 | $2,197,200 | $1,071,200 | $1,126,000 |
| 2023 | $17,813 | $1,781,300 | $870,400 | $910,900 |
| 2022 | $16,719 | $1,589,300 | $696,300 | $893,000 |
| 2021 | $16,437 | $1,577,400 | $696,300 | $881,100 |
| 2020 | $14,766 | $1,421,200 | $589,200 | $832,000 |
| 2019 | $14,654 | $1,364,400 | $562,400 | $802,000 |
| 2018 | $14,445 | $1,310,800 | $508,800 | $802,000 |
| 2017 | $13,990 | $1,270,700 | $468,700 | $802,000 |
| 2016 | $13,956 | $1,257,300 | $455,300 | $802,000 |
| 2015 | $13,949 | $1,258,900 | $455,300 | $803,600 |
| 2014 | $13,494 | $1,216,800 | $455,300 | $761,500 |
Source: Public Records
Map
Nearby Homes
- 23 Wyman Rd
- 282 Pleasant St
- 7 Cottage St
- 41 Atlantic Ave Unit 3
- 41 Atlantic Ave Unit 1
- 34 Lafayette St
- 10 Redstone Ln
- 290 Washington St Unit A
- 30 Haley Rd Unit 1
- 55 Brackett Place Unit B
- 33 W Shore Dr
- 4 Dean Rd
- 8 Linden St
- 6 Mount Vernon St
- 16 Pickwick Rd
- 12 Pickwick Rd
- 66 Pleasant St Unit 2
- 7 Lee St Unit 1
- 197A W Shore Dr Unit A
- 26 Summer St Unit 1
Your Personal Tour Guide
Ask me questions while you tour the home.