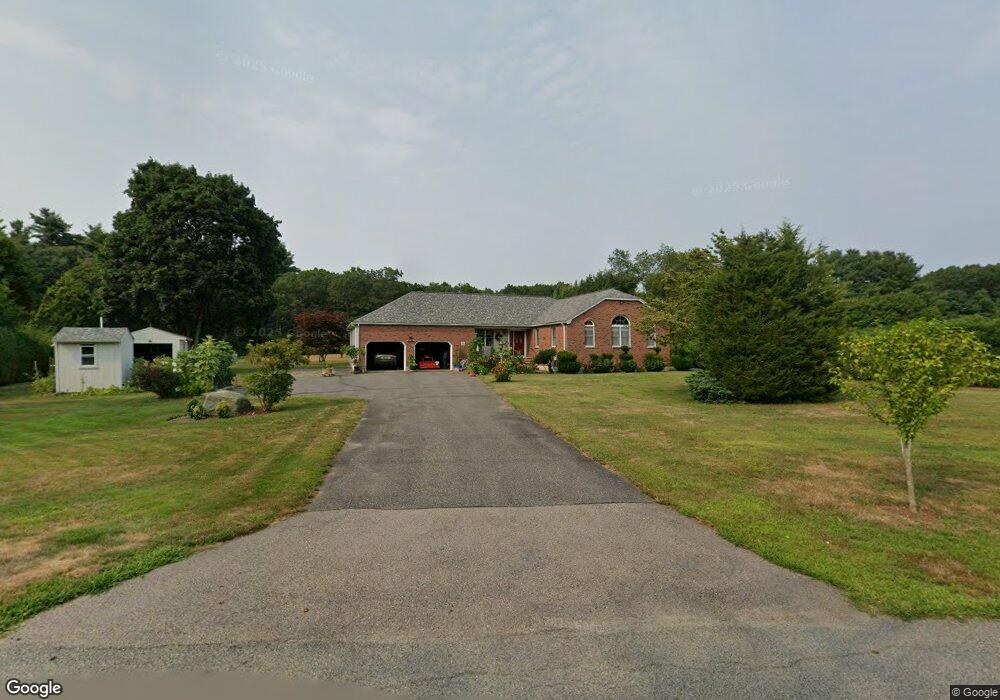
49 Pine St Mansfield, MA 02048
Estimated Value: $716,000 - $813,000
3
Beds
3
Baths
1,751
Sq Ft
$431/Sq Ft
Est. Value
About This Home
This home is located at 49 Pine St, Mansfield, MA 02048 and is currently estimated at $754,567, approximately $430 per square foot. 49 Pine St is a home located in Bristol County with nearby schools including Everett W. Robinson Elementary School, Jordan/Jackson Elementary School, and Harold L. Qualters Middle School.
Ownership History
Date
Name
Owned For
Owner Type
Purchase Details
Closed on
Aug 19, 2016
Sold by
Cannan Paula J
Bought by
Aiello Joseph
Current Estimated Value
Purchase Details
Closed on
Dec 5, 2013
Sold by
Aiello Joseph
Bought by
Canan Paula
Purchase Details
Closed on
Mar 4, 1991
Sold by
Mendonca Mary E
Bought by
Aiello Ft
Home Financials for this Owner
Home Financials are based on the most recent Mortgage that was taken out on this home.
Original Mortgage
$48,000
Interest Rate
9.69%
Mortgage Type
Purchase Money Mortgage
Create a Home Valuation Report for This Property
The Home Valuation Report is an in-depth analysis detailing your home's value as well as a comparison with similar homes in the area
Home Values in the Area
Average Home Value in this Area
Purchase History
| Date | Buyer | Sale Price | Title Company |
|---|---|---|---|
| Aiello Joseph | -- | -- | |
| Canan Paula | -- | -- | |
| Aiello Ft | $60,000 | -- |
Source: Public Records
Mortgage History
| Date | Status | Borrower | Loan Amount |
|---|---|---|---|
| Previous Owner | Aiello Ft | $48,000 |
Source: Public Records
Tax History
| Year | Tax Paid | Tax Assessment Tax Assessment Total Assessment is a certain percentage of the fair market value that is determined by local assessors to be the total taxable value of land and additions on the property. | Land | Improvement |
|---|---|---|---|---|
| 2025 | $8,327 | $632,300 | $257,900 | $374,400 |
| 2024 | $7,606 | $563,400 | $257,900 | $305,500 |
| 2023 | $7,393 | $524,700 | $257,900 | $266,800 |
| 2022 | $7,137 | $470,500 | $239,200 | $231,300 |
| 2021 | $7,242 | $471,500 | $209,000 | $262,500 |
| 2020 | $6,972 | $453,900 | $199,200 | $254,700 |
| 2019 | $6,653 | $437,100 | $166,500 | $270,600 |
| 2018 | $6,152 | $398,200 | $159,100 | $239,100 |
| 2017 | $6,113 | $407,000 | $154,800 | $252,200 |
| 2016 | $6,035 | $391,600 | $147,300 | $244,300 |
| 2015 | $5,461 | $352,300 | $147,300 | $205,000 |
Source: Public Records
Map
Nearby Homes
- 24 Maverick Dr
- 128 Tremont St
- 25 Shepherd St
- 17 Childs Ln
- 150 Gilbert St
- 1769 West St
- 14 Claire Ave
- 401 South St
- 9 Coach Rd
- 84 Messenger St
- 40 Treasure Island Rd
- 16 Treasure Island Rd
- 25 Munroe Dr
- 33 Colonial Way
- 346 South St
- 46 Mirimichi St
- 38 Mirimichi St
- 28 Messenger St
- 115 Westfield Dr
- 57 Vine St
Your Personal Tour Guide
Ask me questions while you tour the home.