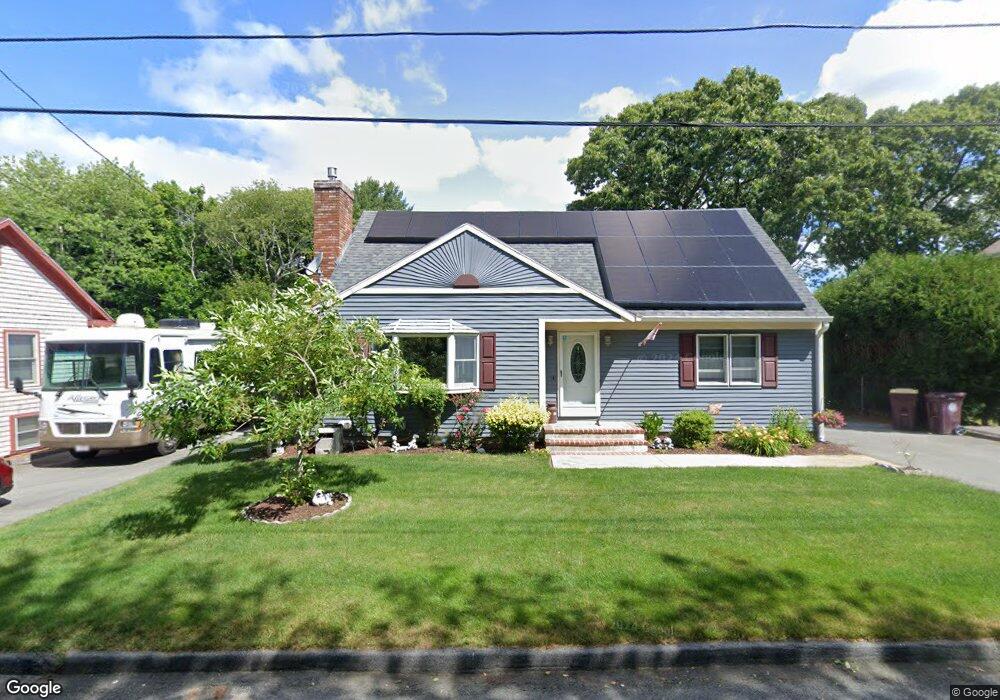
49 Porter St Acushnet, MA 02743
North Fairhaven NeighborhoodEstimated Value: $430,000 - $534,000
Studio
2
Baths
2,002
Sq Ft
$245/Sq Ft
Est. Value
About This Home
This home is located at 49 Porter St, Acushnet, MA 02743 and is currently estimated at $489,816, approximately $244 per square foot. 49 Porter St is a home located in Bristol County with nearby schools including Acushnet Elementary School, Albert F Ford Middle School, and St Francis Xavier Elementary School.
Ownership History
Date
Name
Owned For
Owner Type
Purchase Details
Closed on
Aug 12, 1993
Sold by
Kleva James A and Kleva Cheryl Ann
Bought by
Souza John and Souza Diane Lee
Current Estimated Value
Home Financials for this Owner
Home Financials are based on the most recent Mortgage that was taken out on this home.
Original Mortgage
$97,200
Interest Rate
7.16%
Mortgage Type
Purchase Money Mortgage
Purchase Details
Closed on
Sep 11, 1990
Sold by
Martin Henry V
Bought by
Kleva James A
Create a Home Valuation Report for This Property
The Home Valuation Report is an in-depth analysis detailing your home's value as well as a comparison with similar homes in the area
Home Values in the Area
Average Home Value in this Area
Purchase History
| Date | Buyer | Sale Price | Title Company |
|---|---|---|---|
| Souza John | $112,200 | -- | |
| Kleva James A | $105,000 | -- |
Source: Public Records
Mortgage History
| Date | Status | Borrower | Loan Amount |
|---|---|---|---|
| Open | Kleva James A | $123,000 | |
| Closed | Kleva James A | $143,000 | |
| Closed | Kleva James A | $25,000 | |
| Closed | Kleva James A | $97,200 |
Source: Public Records
Tax History
| Year | Tax Paid | Tax Assessment Tax Assessment Total Assessment is a certain percentage of the fair market value that is determined by local assessors to be the total taxable value of land and additions on the property. | Land | Improvement |
|---|---|---|---|---|
| 2025 | $40 | $374,100 | $89,000 | $285,100 |
| 2024 | $3,915 | $343,100 | $84,800 | $258,300 |
| 2023 | $3,976 | $331,300 | $76,600 | $254,700 |
| 2022 | $3,919 | $295,300 | $72,400 | $222,900 |
| 2021 | $3,599 | $260,200 | $72,400 | $187,800 |
| 2020 | $3,564 | $255,700 | $72,400 | $183,300 |
| 2019 | $3,312 | $233,600 | $64,100 | $169,500 |
| 2018 | $3,191 | $221,300 | $64,100 | $157,200 |
| 2017 | $3,090 | $214,000 | $64,100 | $149,900 |
| 2016 | $3,111 | $214,100 | $64,100 | $150,000 |
| 2015 | $2,837 | $198,700 | $64,100 | $134,600 |
Source: Public Records
Map
Nearby Homes
Your Personal Tour Guide
Ask me questions while you tour the home.