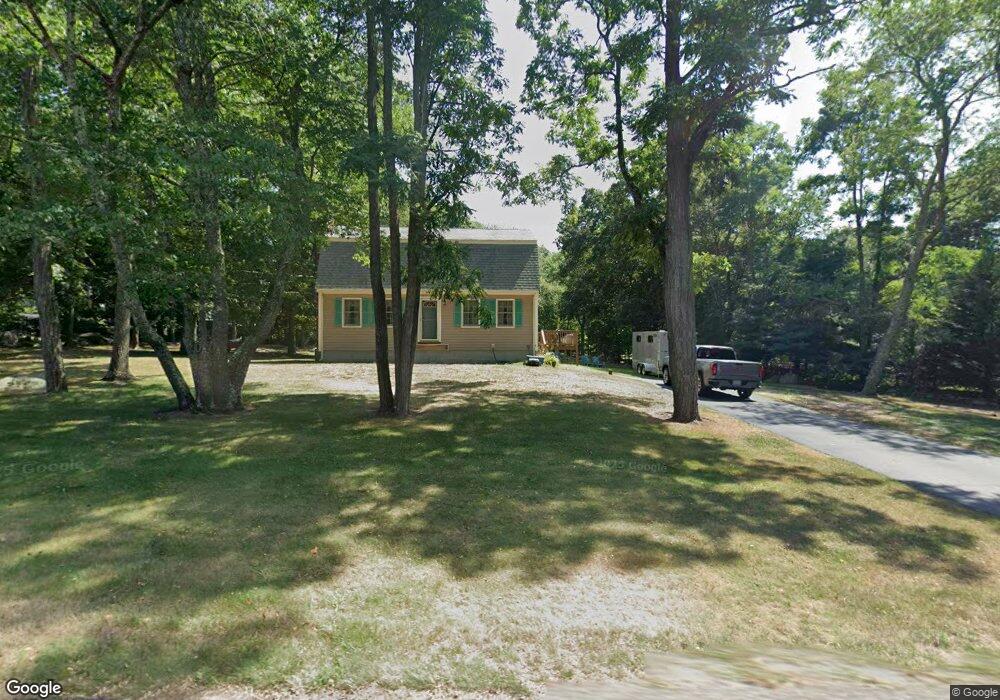
49 Porter St Berkley, MA 02779
Berkley Bridge/Lower Berkley NeighborhoodEstimated Value: $576,000 - $634,000
3
Beds
2
Baths
1,768
Sq Ft
$341/Sq Ft
Est. Value
About This Home
This home is located at 49 Porter St, Berkley, MA 02779 and is currently estimated at $602,603, approximately $340 per square foot. 49 Porter St is a home located in Bristol County with nearby schools including Berkley Community School and Our Lady of Lourdes School.
Ownership History
Date
Name
Owned For
Owner Type
Purchase Details
Closed on
Apr 6, 1992
Sold by
New Bedford Inst Svgs
Bought by
Silva Lmark D and Costa Cheryl Ann
Current Estimated Value
Home Financials for this Owner
Home Financials are based on the most recent Mortgage that was taken out on this home.
Original Mortgage
$111,600
Interest Rate
8.73%
Mortgage Type
Purchase Money Mortgage
Purchase Details
Closed on
Nov 8, 1991
Sold by
Dean Kenneth R
Bought by
New Bedf Inst Svgs
Create a Home Valuation Report for This Property
The Home Valuation Report is an in-depth analysis detailing your home's value as well as a comparison with similar homes in the area
Home Values in the Area
Average Home Value in this Area
Purchase History
| Date | Buyer | Sale Price | Title Company |
|---|---|---|---|
| Silva Lmark D | $124,000 | -- | |
| New Bedf Inst Svgs | $100,000 | -- |
Source: Public Records
Mortgage History
| Date | Status | Borrower | Loan Amount |
|---|---|---|---|
| Closed | New Bedf Inst Svgs | $111,600 | |
| Previous Owner | New Bedf Inst Svgs | $35,000 |
Source: Public Records
Tax History
| Year | Tax Paid | Tax Assessment Tax Assessment Total Assessment is a certain percentage of the fair market value that is determined by local assessors to be the total taxable value of land and additions on the property. | Land | Improvement |
|---|---|---|---|---|
| 2025 | $56 | $463,800 | $163,000 | $300,800 |
| 2024 | $5,361 | $430,600 | $141,000 | $289,600 |
| 2023 | $5,170 | $391,100 | $141,000 | $250,100 |
| 2022 | $5,016 | $364,800 | $123,200 | $241,600 |
| 2021 | $4,881 | $341,800 | $117,500 | $224,300 |
| 2020 | $4,673 | $321,600 | $104,400 | $217,200 |
| 2019 | $4,552 | $310,900 | $104,400 | $206,500 |
| 2018 | $4,172 | $297,600 | $100,600 | $197,000 |
| 2017 | $4,106 | $287,100 | $112,200 | $174,900 |
| 2016 | $3,988 | $268,700 | $112,200 | $156,500 |
| 2015 | $4,213 | $302,900 | $144,100 | $158,800 |
| 2014 | $3,856 | $301,000 | $144,100 | $156,900 |
Source: Public Records
Map
Nearby Homes
- 2 Bc Ln
- 2 Lima Ln
- LOT 2A Hudson Dr Unit 2A
- 73 Seymour St
- 0 Anthony St
- 66 S Main St
- 23 Elmwood Dr
- 1969 County St
- 1524 Somerset Ave
- 143 Morrison Rd
- 90 E Water St
- 220 Erin Rd
- 12 Beacon St
- 6 Southeast St
- 852 Somerset Ave
- 0 Hart St Unit 73474079
- 450 Somerset Ave Unit 3-7
- 298 Wren St
- 4 Staples Ave
- 600 County St
Your Personal Tour Guide
Ask me questions while you tour the home.