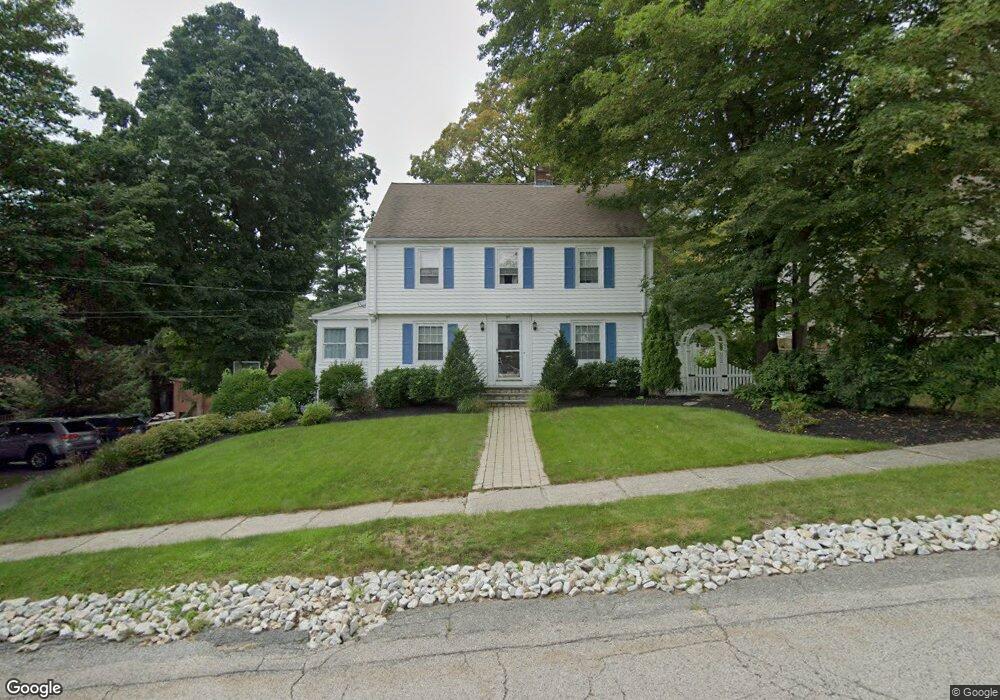
49 Prospect St Whitinsville, MA 01588
Estimated Value: $522,000 - $626,000
4
Beds
2
Baths
1,906
Sq Ft
$302/Sq Ft
Est. Value
About This Home
This home is located at 49 Prospect St, Whitinsville, MA 01588 and is currently estimated at $576,011, approximately $302 per square foot. 49 Prospect St is a home located in Worcester County with nearby schools including Northbridge Elementary School, Northbridge Middle School, and Northbridge High School.
Ownership History
Date
Name
Owned For
Owner Type
Purchase Details
Closed on
Jun 30, 1999
Sold by
Saunders James Perkins
Bought by
Downing Paul M and Downing Heliana O
Current Estimated Value
Home Financials for this Owner
Home Financials are based on the most recent Mortgage that was taken out on this home.
Original Mortgage
$115,000
Outstanding Balance
$31,272
Interest Rate
7.19%
Mortgage Type
Purchase Money Mortgage
Estimated Equity
$544,739
Create a Home Valuation Report for This Property
The Home Valuation Report is an in-depth analysis detailing your home's value as well as a comparison with similar homes in the area
Home Values in the Area
Average Home Value in this Area
Purchase History
| Date | Buyer | Sale Price | Title Company |
|---|---|---|---|
| Downing Paul M | $171,000 | -- | |
| Downing Paul M | $171,000 | -- |
Source: Public Records
Mortgage History
| Date | Status | Borrower | Loan Amount |
|---|---|---|---|
| Open | Downing Paul M | $115,000 | |
| Closed | Downing Paul M | $115,000 |
Source: Public Records
Tax History Compared to Growth
Tax History
| Year | Tax Paid | Tax Assessment Tax Assessment Total Assessment is a certain percentage of the fair market value that is determined by local assessors to be the total taxable value of land and additions on the property. | Land | Improvement |
|---|---|---|---|---|
| 2025 | $5,251 | $445,400 | $153,700 | $291,700 |
| 2024 | $5,079 | $420,100 | $153,700 | $266,400 |
| 2023 | $5,115 | $394,700 | $153,700 | $241,000 |
| 2022 | $4,698 | $341,200 | $118,300 | $222,900 |
| 2021 | $4,579 | $316,000 | $112,600 | $203,400 |
| 2020 | $4,252 | $307,200 | $112,600 | $194,600 |
| 2019 | $3,822 | $294,700 | $112,600 | $182,100 |
| 2018 | $3,657 | $282,600 | $107,100 | $175,500 |
| 2017 | $3,646 | $269,500 | $107,100 | $162,400 |
| 2016 | $3,385 | $246,200 | $97,400 | $148,800 |
| 2015 | $3,294 | $246,200 | $97,400 | $148,800 |
| 2014 | $3,265 | $246,200 | $97,400 | $148,800 |
Source: Public Records
Map
Nearby Homes
- Lots 1-9 Spring St
- 18 East St Unit 24
- 90 Nathaniel Dr
- 21 Granite St
- 121 East St Unit 121
- 128 Linwood Ave
- 5 Summit St
- 894 Marston Rd
- 1 Elm St
- 708 Marston Rd
- 9 Banning Dr
- 33 Crestwood Cir Unit 45
- 140 Rolling Ridge Dr Unit 78
- 39 Crestwood Cir Unit 42
- 192 Rebecca Rd
- 46 Rebecca Rd
- 159 Rolling Ridge Dr Unit 85
- 169 Rolling Ridge Dr Unit 97
- 24 Crescent St Unit 6
- 99 Country Club Dr
- 53 Prospect St
- 41 Prospect St
- 44 Prospect St Unit 46
- 65-67 Prospect St
- 54 Prospect St Unit 56
- 57 Prospect St
- 50 Prospect St
- 42 Prospect St
- 42 Prospect St Unit 1
- 39 Prospect St
- 40 Prospect St Unit 2
- 40 Prospect St Unit 42
- 38 Prospect St
- 62 Prospect St
- 35 Prospect St
- 61 Prospect St
- 29 Prospect St Unit 31
- 68 Prospect St
- 54-56 Prospect St
- 28 Prospect St Unit 28