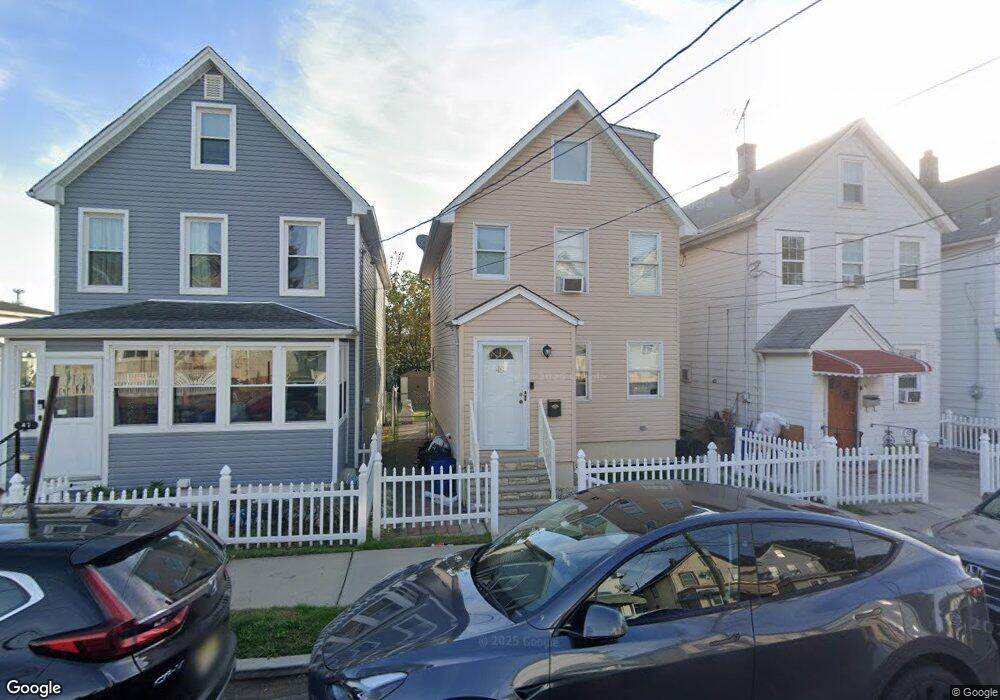
49 Randolph St Carteret, NJ 07008
Estimated Value: $371,000 - $482,000
3
Beds
2
Baths
1,286
Sq Ft
$334/Sq Ft
Est. Value
About This Home
This home is located at 49 Randolph St, Carteret, NJ 07008 and is currently estimated at $429,974, approximately $334 per square foot. 49 Randolph St is a home located in Middlesex County with nearby schools including Carteret High School and St Joseph School.
Ownership History
Date
Name
Owned For
Owner Type
Purchase Details
Closed on
Apr 18, 2023
Sold by
Ortiz Elizabeth
Bought by
Elizabeth Ortiz Revocable Living Trust
Current Estimated Value
Purchase Details
Closed on
Nov 14, 2008
Sold by
Pecho Eduardo and Diaz Elizabeth J
Bought by
Sifuentes Ivan and Diaz Elizabeth J
Home Financials for this Owner
Home Financials are based on the most recent Mortgage that was taken out on this home.
Original Mortgage
$258,964
Interest Rate
6.03%
Mortgage Type
FHA
Purchase Details
Closed on
Nov 25, 2003
Sold by
Seelamsetty Prabhakar
Bought by
Pecho Eduardo and Diaz Elizabeth J
Create a Home Valuation Report for This Property
The Home Valuation Report is an in-depth analysis detailing your home's value as well as a comparison with similar homes in the area
Home Values in the Area
Average Home Value in this Area
Purchase History
| Date | Buyer | Sale Price | Title Company |
|---|---|---|---|
| Elizabeth Ortiz Revocable Living Trust | -- | None Listed On Document | |
| Sifuentes Ivan | -- | None Available | |
| Pecho Eduardo | $198,000 | -- |
Source: Public Records
Mortgage History
| Date | Status | Borrower | Loan Amount |
|---|---|---|---|
| Previous Owner | Sifuentes Ivan | $258,964 |
Source: Public Records
Tax History Compared to Growth
Tax History
| Year | Tax Paid | Tax Assessment Tax Assessment Total Assessment is a certain percentage of the fair market value that is determined by local assessors to be the total taxable value of land and additions on the property. | Land | Improvement |
|---|---|---|---|---|
| 2025 | $5,295 | $424,100 | $246,300 | $177,800 |
| 2024 | $5,159 | $166,100 | $52,500 | $113,600 |
| 2023 | $5,159 | $166,100 | $52,500 | $113,600 |
| 2022 | $5,016 | $166,100 | $52,500 | $113,600 |
| 2021 | $3,676 | $166,100 | $52,500 | $113,600 |
| 2020 | $4,777 | $166,100 | $52,500 | $113,600 |
| 2019 | $4,639 | $166,100 | $52,500 | $113,600 |
| 2018 | $4,530 | $166,100 | $52,500 | $113,600 |
| 2017 | $4,368 | $166,100 | $52,500 | $113,600 |
| 2016 | $4,915 | $155,200 | $52,500 | $102,700 |
| 2015 | $4,844 | $155,200 | $52,500 | $102,700 |
| 2014 | $4,633 | $155,200 | $52,500 | $102,700 |
Source: Public Records
Map
Nearby Homes
- 42 Randolph St
- 97 Randolph St
- 89 Sharot St
- 613 Roosevelt Ave
- 6 Fitch St
- 4 Lefferts St
- 23 Leick Ave
- 18 John St
- 519 Roosevelt Ave
- 141 Emerson St
- 165 Randolph St
- 56 Thornal St
- 22 N Whittier St Unit B
- 72 Charles St
- 123 Heald St
- 84-86 Washington Ave
- 114 Washington Ave
- 73 Edgar St
- 58 Hayward Ave
- 160 Pershing Ave