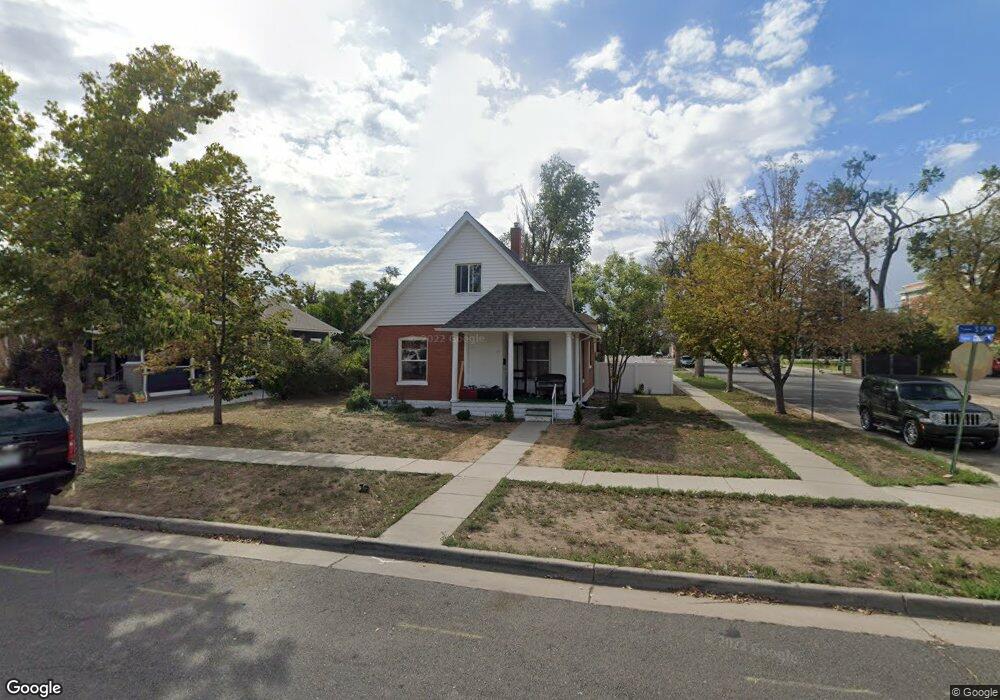
49 S 5th Ave Brighton, CO 80601
Estimated Value: $349,357 - $379,000
3
Beds
1
Bath
905
Sq Ft
$406/Sq Ft
Est. Value
About This Home
This home is located at 49 S 5th Ave, Brighton, CO 80601 and is currently estimated at $367,786, approximately $406 per square foot. 49 S 5th Ave is a home with nearby schools including South Elementary School, Vikan Middle School, and Brighton High School.
Ownership History
Date
Name
Owned For
Owner Type
Purchase Details
Closed on
Dec 16, 2021
Sold by
Housing Authority Of City Of Brighton
Bought by
49 South 5Th Llc
Current Estimated Value
Home Financials for this Owner
Home Financials are based on the most recent Mortgage that was taken out on this home.
Original Mortgage
$265,000
Outstanding Balance
$175,158
Interest Rate
3.12%
Mortgage Type
Commercial
Estimated Equity
$192,628
Purchase Details
Closed on
Jul 20, 2021
Sold by
City Of Brighton
Bought by
Housing Authority Of City Of Brighton
Purchase Details
Closed on
Dec 30, 2003
Sold by
Sheahan Sten and Sheahan Cynthia
Bought by
The City Of Brighton
Purchase Details
Closed on
Feb 28, 1997
Sold by
Relford Helen G and Relford Val J
Bought by
Sheahan Sten and Sheahan Cynthia
Home Financials for this Owner
Home Financials are based on the most recent Mortgage that was taken out on this home.
Original Mortgage
$80,000
Interest Rate
12.5%
Purchase Details
Closed on
Oct 18, 1996
Sold by
Relford Helen G
Bought by
Relford Val J
Create a Home Valuation Report for This Property
The Home Valuation Report is an in-depth analysis detailing your home's value as well as a comparison with similar homes in the area
Home Values in the Area
Average Home Value in this Area
Purchase History
| Date | Buyer | Sale Price | Title Company |
|---|---|---|---|
| 49 South 5Th Llc | -- | None Available | |
| Housing Authority Of City Of Brighton | -- | None Available | |
| The City Of Brighton | $192,500 | -- | |
| Sheahan Sten | $100,000 | -- | |
| Relford Val J | -- | -- |
Source: Public Records
Mortgage History
| Date | Status | Borrower | Loan Amount |
|---|---|---|---|
| Open | 49 South 5Th Llc | $265,000 | |
| Previous Owner | Sheahan Sten | $80,000 |
Source: Public Records
Tax History Compared to Growth
Tax History
| Year | Tax Paid | Tax Assessment Tax Assessment Total Assessment is a certain percentage of the fair market value that is determined by local assessors to be the total taxable value of land and additions on the property. | Land | Improvement |
|---|---|---|---|---|
| 2024 | $2,376 | $23,690 | $5,310 | $18,380 |
| 2023 | $2,376 | $25,300 | $5,410 | $19,890 |
| 2022 | $2,279 | $20,750 | $4,930 | $15,820 |
| 2021 | $0 | $20,750 | $4,930 | $15,820 |
| 2020 | $0 | $36,100 | $19,720 | $16,380 |
| 2019 | $0 | $36,100 | $19,720 | $16,380 |
| 2018 | $0 | $35,520 | $19,140 | $16,380 |
| 2017 | $0 | $35,520 | $19,140 | $16,380 |
| 2016 | -- | $25,080 | $8,700 | $16,380 |
| 2015 | -- | $25,080 | $8,700 | $16,380 |
| 2014 | -- | $22,560 | $6,960 | $15,600 |
Source: Public Records
Map
Nearby Homes