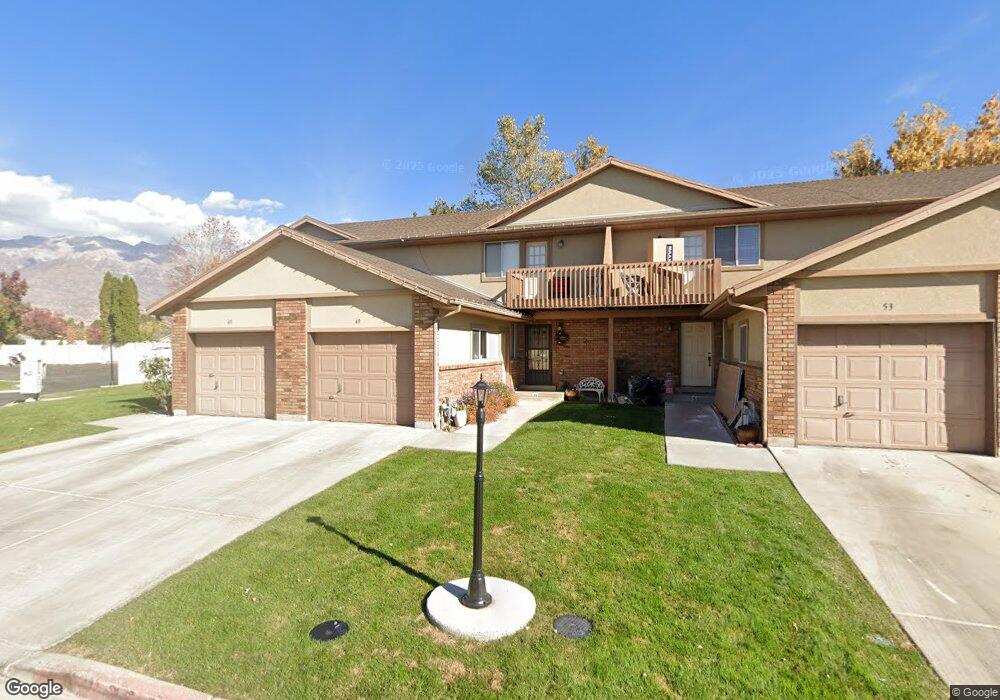
49 S 980 W Orem, UT 84058
Orem Park NeighborhoodEstimated Value: $409,755 - $431,000
3
Beds
4
Baths
1,816
Sq Ft
$233/Sq Ft
Est. Value
About This Home
This home is located at 49 S 980 W, Orem, UT 84058 and is currently estimated at $422,918, approximately $232 per square foot. 49 S 980 W is a home located in Utah County with nearby schools including Orem Elementary School, Orem Junior High School, and Mountain View High School.
Ownership History
Date
Name
Owned For
Owner Type
Purchase Details
Closed on
Jul 18, 2003
Sold by
Johnson Sandra G
Bought by
Livingston Tyler D
Current Estimated Value
Home Financials for this Owner
Home Financials are based on the most recent Mortgage that was taken out on this home.
Original Mortgage
$114,750
Interest Rate
5.15%
Mortgage Type
Purchase Money Mortgage
Purchase Details
Closed on
Mar 31, 1999
Sold by
Bos Mickelle C
Bought by
Johnson Sandy G
Home Financials for this Owner
Home Financials are based on the most recent Mortgage that was taken out on this home.
Original Mortgage
$89,900
Interest Rate
6.79%
Purchase Details
Closed on
Jan 23, 1998
Sold by
Bos Stephen R and Bos Mickelle C
Bought by
Bos Mickelle C
Create a Home Valuation Report for This Property
The Home Valuation Report is an in-depth analysis detailing your home's value as well as a comparison with similar homes in the area
Home Values in the Area
Average Home Value in this Area
Purchase History
| Date | Buyer | Sale Price | Title Company |
|---|---|---|---|
| Livingston Tyler D | -- | Equity Title Agency Inc | |
| Johnson Sandy G | -- | Sundance Title Insurance | |
| Bos Mickelle C | -- | -- |
Source: Public Records
Mortgage History
| Date | Status | Borrower | Loan Amount |
|---|---|---|---|
| Previous Owner | Livingston Tyler D | $114,750 | |
| Previous Owner | Johnson Sandy G | $89,900 |
Source: Public Records
Tax History
| Year | Tax Paid | Tax Assessment Tax Assessment Total Assessment is a certain percentage of the fair market value that is determined by local assessors to be the total taxable value of land and additions on the property. | Land | Improvement |
|---|---|---|---|---|
| 2025 | $1,663 | $203,665 | -- | -- |
| 2024 | $1,663 | $203,390 | $0 | $0 |
| 2023 | $1,482 | $194,810 | $0 | $0 |
| 2022 | $1,546 | $196,900 | $0 | $0 |
| 2021 | $1,456 | $280,800 | $33,700 | $247,100 |
| 2020 | $1,323 | $250,700 | $30,100 | $220,600 |
| 2019 | $1,223 | $241,000 | $31,300 | $209,700 |
| 2018 | $1,113 | $209,500 | $26,000 | $183,500 |
| 2017 | $1,068 | $107,690 | $0 | $0 |
| 2016 | $1,035 | $96,250 | $0 | $0 |
| 2015 | $1,094 | $96,250 | $0 | $0 |
| 2014 | $975 | $85,415 | $0 | $0 |
Source: Public Records
Map
Nearby Homes
- 896 W 30 S
- 45 N 970 W
- 155 S 1200 W Unit 69
- 155 S 1200 W Unit 6
- 155 S 1200 W Unit 97
- 237 S Ridgeview Dr
- 1110 W 105 N
- 288 S 800 W
- 278 S 1160 W
- 1225 W 160 N
- 935 W 360 S
- 222 N 1200 W Unit 144
- 222 N 1200 W Unit 84
- 350 S 1200 W Unit 2
- 565 W 40 N
- 508 W 40 N
- 1004 W 400 N
- 506 S 800 West St Unit 13
- 520 S 800 W Unit 14
- 1094 W 465 N
Your Personal Tour Guide
Ask me questions while you tour the home.