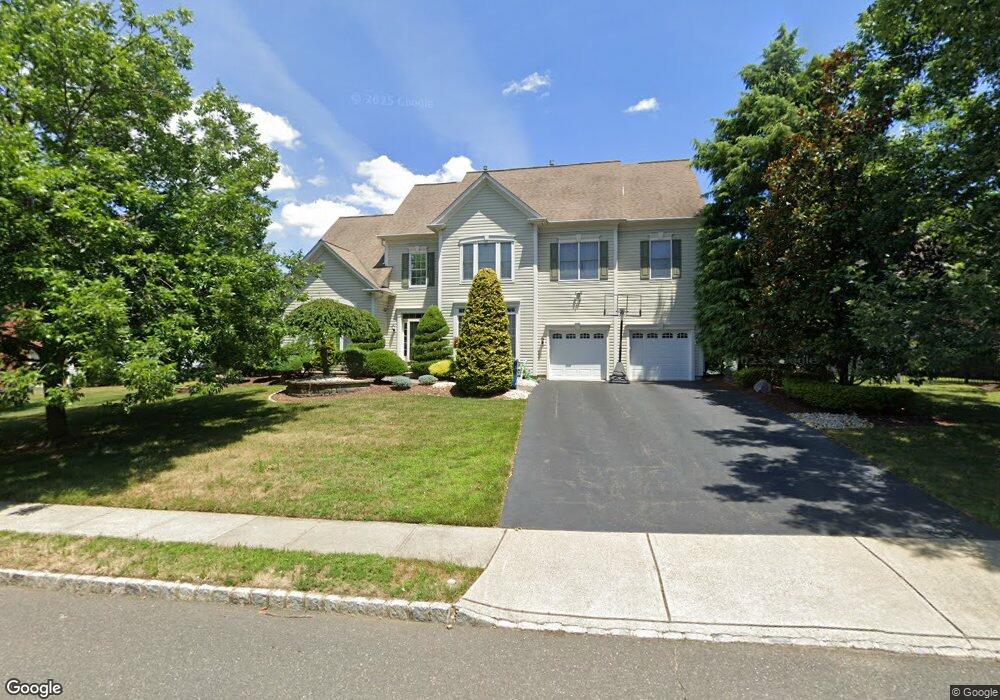
49 Sage St Holmdel, NJ 07733
Estimated Value: $1,561,653 - $1,710,000
4
Beds
3
Baths
4,089
Sq Ft
$401/Sq Ft
Est. Value
About This Home
This home is located at 49 Sage St, Holmdel, NJ 07733 and is currently estimated at $1,639,413, approximately $400 per square foot. 49 Sage St is a home located in Monmouth County with nearby schools including Village School, Indian Hill Elementary School, and William Satz Intermediate School.
Ownership History
Date
Name
Owned For
Owner Type
Purchase Details
Closed on
Sep 1, 2005
Sold by
Chan Ben
Bought by
Safari Matt M and Nikoo Negar T
Current Estimated Value
Home Financials for this Owner
Home Financials are based on the most recent Mortgage that was taken out on this home.
Original Mortgage
$825,000
Interest Rate
6.14%
Mortgage Type
New Conventional
Purchase Details
Closed on
Nov 20, 2002
Sold by
Pulte Home Corp
Bought by
Chan Ben and Chan Virginia
Home Financials for this Owner
Home Financials are based on the most recent Mortgage that was taken out on this home.
Original Mortgage
$400,000
Interest Rate
6.11%
Create a Home Valuation Report for This Property
The Home Valuation Report is an in-depth analysis detailing your home's value as well as a comparison with similar homes in the area
Home Values in the Area
Average Home Value in this Area
Purchase History
| Date | Buyer | Sale Price | Title Company |
|---|---|---|---|
| Safari Matt M | $1,105,000 | -- | |
| Chan Ben | $699,995 | -- |
Source: Public Records
Mortgage History
| Date | Status | Borrower | Loan Amount |
|---|---|---|---|
| Previous Owner | Safari Matt M | $825,000 | |
| Previous Owner | Chan Ben | $400,000 |
Source: Public Records
Tax History
| Year | Tax Paid | Tax Assessment Tax Assessment Total Assessment is a certain percentage of the fair market value that is determined by local assessors to be the total taxable value of land and additions on the property. | Land | Improvement |
|---|---|---|---|---|
| 2025 | $21,380 | $1,396,000 | $634,100 | $761,900 |
| 2024 | $20,661 | $1,356,600 | $664,000 | $692,600 |
| 2023 | $20,661 | $1,269,900 | $620,500 | $649,400 |
| 2022 | $19,095 | $1,065,100 | $531,500 | $533,600 |
| 2021 | $19,095 | $951,900 | $438,800 | $513,100 |
| 2020 | $19,872 | $974,600 | $429,100 | $545,500 |
| 2019 | $19,586 | $965,300 | $402,600 | $562,700 |
| 2018 | $19,042 | $942,200 | $337,700 | $604,500 |
| 2017 | $18,843 | $928,700 | $296,700 | $632,000 |
| 2016 | $20,287 | $1,011,300 | $330,700 | $680,600 |
| 2015 | $19,898 | $995,400 | $384,000 | $611,400 |
| 2014 | $18,419 | $881,300 | $403,400 | $477,900 |
Source: Public Records
Map
Nearby Homes
Your Personal Tour Guide
Ask me questions while you tour the home.