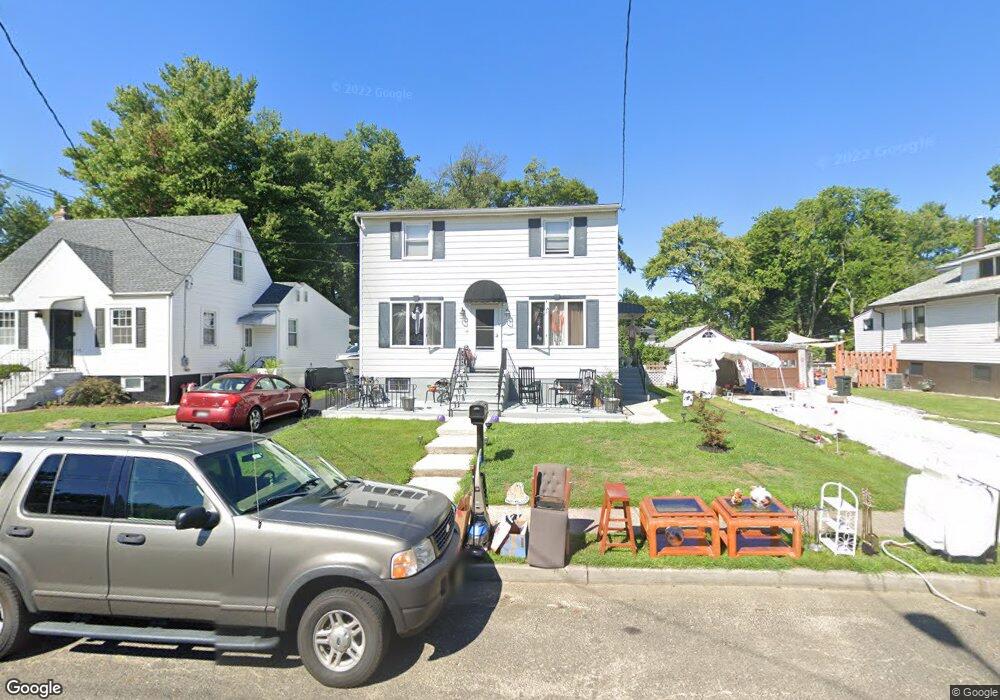
49 Sartori Ave Mount Ephraim, NJ 08059
Estimated Value: $273,000 - $345,000
--
Bed
--
Bath
1,708
Sq Ft
$181/Sq Ft
Est. Value
About This Home
This home is located at 49 Sartori Ave, Mount Ephraim, NJ 08059 and is currently estimated at $308,408, approximately $180 per square foot. 49 Sartori Ave is a home located in Camden County with nearby schools including Mary Bray Elementary School, Raymond W. Kershaw Elementary School, and Gloucester Catholic Junior Senior High School.
Ownership History
Date
Name
Owned For
Owner Type
Purchase Details
Closed on
Jul 19, 2010
Sold by
Fasulo Angelo F and Fasulo Anthony O
Bought by
Fasulo Ronald F
Current Estimated Value
Home Financials for this Owner
Home Financials are based on the most recent Mortgage that was taken out on this home.
Original Mortgage
$126,500
Outstanding Balance
$83,682
Interest Rate
4.63%
Mortgage Type
Purchase Money Mortgage
Estimated Equity
$224,726
Create a Home Valuation Report for This Property
The Home Valuation Report is an in-depth analysis detailing your home's value as well as a comparison with similar homes in the area
Home Values in the Area
Average Home Value in this Area
Purchase History
| Date | Buyer | Sale Price | Title Company |
|---|---|---|---|
| Fasulo Ronald F | -- | -- |
Source: Public Records
Mortgage History
| Date | Status | Borrower | Loan Amount |
|---|---|---|---|
| Open | Fasulo Ronald F | $126,500 |
Source: Public Records
Tax History Compared to Growth
Tax History
| Year | Tax Paid | Tax Assessment Tax Assessment Total Assessment is a certain percentage of the fair market value that is determined by local assessors to be the total taxable value of land and additions on the property. | Land | Improvement |
|---|---|---|---|---|
| 2025 | $9,112 | $174,400 | $41,500 | $132,900 |
| 2024 | $8,992 | $174,400 | $41,500 | $132,900 |
| 2023 | $8,992 | $174,400 | $41,500 | $132,900 |
| 2022 | $8,750 | $174,400 | $41,500 | $132,900 |
| 2021 | $7,950 | $174,400 | $41,500 | $132,900 |
| 2020 | $8,275 | $174,400 | $41,500 | $132,900 |
| 2019 | $8,125 | $174,400 | $41,500 | $132,900 |
| 2018 | $8,054 | $174,400 | $41,500 | $132,900 |
| 2017 | $7,935 | $174,400 | $41,500 | $132,900 |
| 2016 | $7,686 | $174,400 | $41,500 | $132,900 |
| 2015 | $7,421 | $174,400 | $41,500 | $132,900 |
| 2014 | $7,485 | $111,000 | $28,100 | $82,900 |
Source: Public Records
Map
Nearby Homes