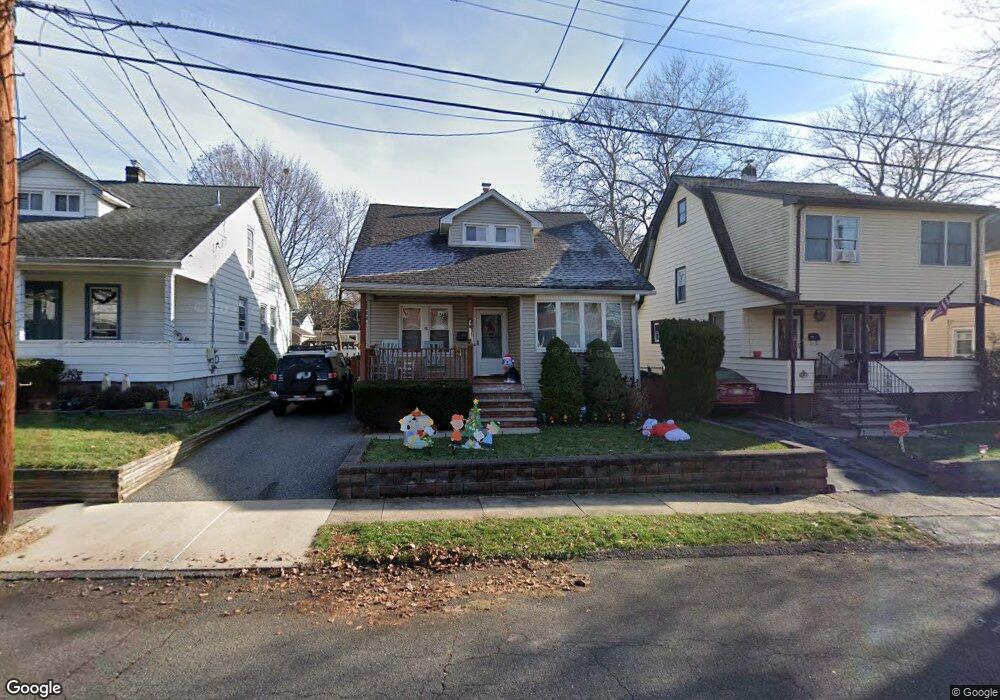
49 Shelby St Dumont, NJ 07628
Estimated Value: $546,000 - $617,000
--
Bed
--
Bath
1,478
Sq Ft
$392/Sq Ft
Est. Value
About This Home
This home is located at 49 Shelby St, Dumont, NJ 07628 and is currently estimated at $578,799, approximately $391 per square foot. 49 Shelby St is a home located in Bergen County with nearby schools including Dumont High School.
Ownership History
Date
Name
Owned For
Owner Type
Purchase Details
Closed on
May 23, 2008
Sold by
Jover Julio R and Jover Carmen R
Bought by
Soltis Michael and Soltis Lisa
Current Estimated Value
Home Financials for this Owner
Home Financials are based on the most recent Mortgage that was taken out on this home.
Original Mortgage
$333,000
Outstanding Balance
$211,218
Interest Rate
5.91%
Mortgage Type
New Conventional
Estimated Equity
$367,581
Purchase Details
Closed on
Jun 1, 1999
Sold by
Dunlea John J and Dunlea Mary C
Bought by
Alloca Philip C and Alloca Denise M
Home Financials for this Owner
Home Financials are based on the most recent Mortgage that was taken out on this home.
Original Mortgage
$144,000
Interest Rate
7.19%
Create a Home Valuation Report for This Property
The Home Valuation Report is an in-depth analysis detailing your home's value as well as a comparison with similar homes in the area
Home Values in the Area
Average Home Value in this Area
Purchase History
| Date | Buyer | Sale Price | Title Company |
|---|---|---|---|
| Soltis Michael | $370,000 | -- | |
| Alloca Philip C | $180,000 | Quest Title Agency Inc |
Source: Public Records
Mortgage History
| Date | Status | Borrower | Loan Amount |
|---|---|---|---|
| Open | Soltis Michael | $333,000 | |
| Previous Owner | Alloca Philip C | $144,000 |
Source: Public Records
Tax History Compared to Growth
Tax History
| Year | Tax Paid | Tax Assessment Tax Assessment Total Assessment is a certain percentage of the fair market value that is determined by local assessors to be the total taxable value of land and additions on the property. | Land | Improvement |
|---|---|---|---|---|
| 2025 | $9,858 | $469,200 | $268,000 | $201,200 |
| 2024 | $9,615 | $242,500 | $140,000 | $102,500 |
| 2023 | $9,416 | $242,500 | $140,000 | $102,500 |
| 2022 | $9,416 | $242,500 | $140,000 | $102,500 |
| 2021 | $9,370 | $242,500 | $140,000 | $102,500 |
| 2020 | $9,116 | $242,500 | $140,000 | $102,500 |
| 2019 | $8,897 | $242,500 | $140,000 | $102,500 |
| 2018 | $8,715 | $242,500 | $140,000 | $102,500 |
| 2017 | $8,548 | $242,500 | $140,000 | $102,500 |
| 2016 | $8,349 | $242,500 | $140,000 | $102,500 |
| 2015 | $8,158 | $242,500 | $140,000 | $102,500 |
| 2014 | $7,998 | $242,500 | $140,000 | $102,500 |
Source: Public Records
Map
Nearby Homes
- 203 New York Ave
- 136 Elm St
- 23 Cherry Ct
- 40 Depew St
- 181 Phelps Ave
- 48 Colonial Pkwy
- 79 Blauvelt Ave
- 35 Wolcott Rd
- 139 Stonegate Trail
- 280 Hickory Ave
- 12 Spruce St
- 41 Monument Place
- 156 E Linden Ave
- 9 New York Ave
- 20 Dojean Ct
- 27A Park Ave
- 44 Bogert Place
- 254 Concord St
- 17 Jefferson Ave
- 61 Jefferson Ave