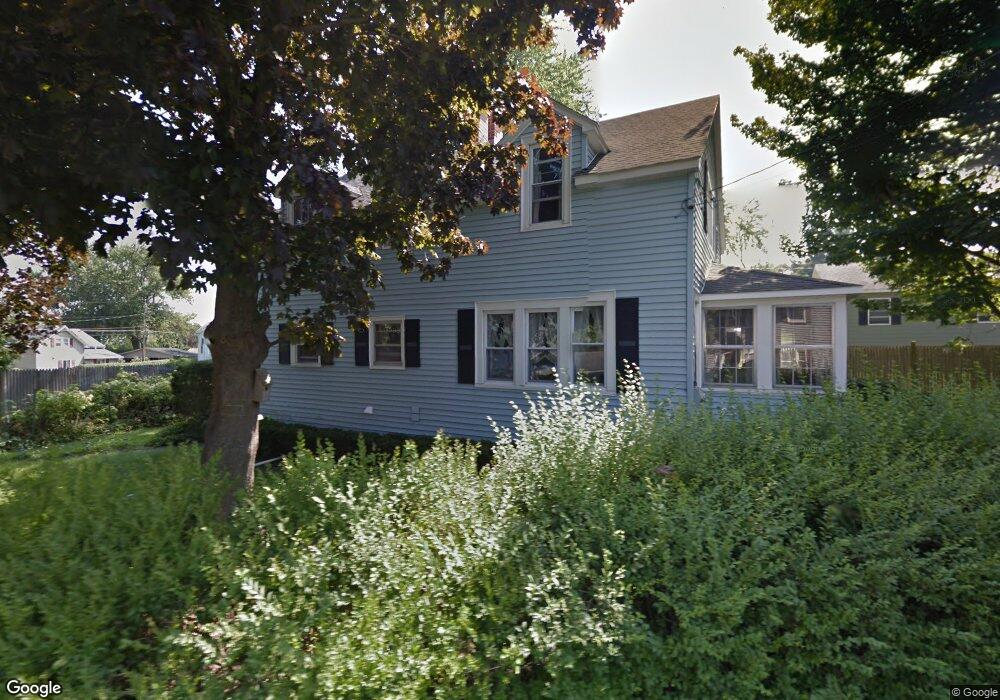
49 Shore Dr Pittsfield, MA 01201
Estimated Value: $341,000 - $503,000
3
Beds
2
Baths
1,632
Sq Ft
$250/Sq Ft
Est. Value
About This Home
This home is located at 49 Shore Dr, Pittsfield, MA 01201 and is currently estimated at $407,719, approximately $249 per square foot. 49 Shore Dr is a home located in Berkshire County with nearby schools including Robert T. Capeless Elementary School, John T. Reid Middle School, and Taconic High School.
Ownership History
Date
Name
Owned For
Owner Type
Purchase Details
Closed on
May 15, 1998
Sold by
Rennie Robert P
Bought by
Geer C Marguerite
Current Estimated Value
Home Financials for this Owner
Home Financials are based on the most recent Mortgage that was taken out on this home.
Original Mortgage
$75,000
Outstanding Balance
$14,629
Interest Rate
7.08%
Mortgage Type
Purchase Money Mortgage
Estimated Equity
$393,090
Purchase Details
Closed on
Dec 15, 1995
Sold by
Rennie Catherine F
Bought by
Rennie Robert P
Home Financials for this Owner
Home Financials are based on the most recent Mortgage that was taken out on this home.
Original Mortgage
$30,000
Interest Rate
7.43%
Mortgage Type
Purchase Money Mortgage
Create a Home Valuation Report for This Property
The Home Valuation Report is an in-depth analysis detailing your home's value as well as a comparison with similar homes in the area
Home Values in the Area
Average Home Value in this Area
Purchase History
| Date | Buyer | Sale Price | Title Company |
|---|---|---|---|
| Geer C Marguerite | $95,000 | -- | |
| Geer C Marguerite | $95,000 | -- | |
| Rennie Robert P | $70,000 | -- | |
| Rennie Robert P | $70,000 | -- |
Source: Public Records
Mortgage History
| Date | Status | Borrower | Loan Amount |
|---|---|---|---|
| Open | Rennie Robert P | $75,000 | |
| Closed | Rennie Robert P | $75,000 | |
| Previous Owner | Rennie Robert P | $30,000 |
Source: Public Records
Tax History Compared to Growth
Tax History
| Year | Tax Paid | Tax Assessment Tax Assessment Total Assessment is a certain percentage of the fair market value that is determined by local assessors to be the total taxable value of land and additions on the property. | Land | Improvement |
|---|---|---|---|---|
| 2025 | $4,801 | $267,600 | $61,800 | $205,800 |
| 2024 | $4,417 | $239,400 | $61,800 | $177,600 |
| 2023 | $4,005 | $218,600 | $57,000 | $161,600 |
| 2022 | $3,454 | $186,100 | $45,600 | $140,500 |
| 2021 | $3,130 | $162,600 | $45,600 | $117,000 |
| 2020 | $3,124 | $158,500 | $45,600 | $112,900 |
| 2019 | $2,936 | $151,200 | $45,600 | $105,600 |
| 2018 | $2,925 | $146,200 | $44,400 | $101,800 |
| 2017 | $2,681 | $136,600 | $41,600 | $95,000 |
| 2016 | $2,548 | $135,800 | $41,600 | $94,200 |
| 2015 | $2,453 | $135,800 | $41,600 | $94,200 |
Source: Public Records
Map
Nearby Homes