Estimated Value: $91,257 - $193,000
2
Beds
1
Bath
840
Sq Ft
$164/Sq Ft
Est. Value
About This Home
This home is located at 49 Spring Creek St, Pryor, OK 74361 and is currently estimated at $137,814, approximately $164 per square foot. 49 Spring Creek St is a home with nearby schools including Locust Grove Early Lrning Center, Locust Grove Upper Elementary School, and Locust Grove Middle School.
Ownership History
Date
Name
Owned For
Owner Type
Purchase Details
Closed on
Apr 30, 2019
Sold by
Cunningham Catherine M and Nationstar Mortgage Llc
Bought by
Fannie Mae and Federal National Mortgage Association
Current Estimated Value
Purchase Details
Closed on
Jun 9, 2014
Sold by
Mayes County Treasurer
Bought by
Langston Larry
Purchase Details
Closed on
Feb 20, 2013
Sold by
Cunningham Catherine M and Doe John
Bought by
Fannie Mae and Federal National Mortgage Association
Purchase Details
Closed on
Dec 19, 2012
Sold by
Cunningham Catherine M
Bought by
Fannie Mae and Federal National Mortgage Association
Purchase Details
Closed on
May 22, 2007
Sold by
Cunnghan Catherine
Bought by
Ledbetter Michael
Purchase Details
Closed on
Oct 3, 2000
Sold by
Thornburg Richard
Bought by
Cunningham Catherine
Purchase Details
Closed on
Mar 5, 1999
Sold by
Spencer Joe
Bought by
Thornburg Richard
Purchase Details
Closed on
Jun 9, 1998
Sold by
Hammack Jerry
Bought by
Spencer Joe R
Create a Home Valuation Report for This Property
The Home Valuation Report is an in-depth analysis detailing your home's value as well as a comparison with similar homes in the area
Home Values in the Area
Average Home Value in this Area
Purchase History
| Date | Buyer | Sale Price | Title Company |
|---|---|---|---|
| Fannie Mae | $62,729 | None Available | |
| Langston Larry | $4,050 | None Available | |
| Fannie Mae | $62,729 | None Available | |
| Fannie Mae | $62,729 | None Available | |
| Ledbetter Michael | -- | None Available | |
| Cunningham Catherine | $32,500 | -- | |
| Thornburg Richard | $27,000 | -- | |
| Spencer Joe R | $26,500 | -- |
Source: Public Records
Tax History Compared to Growth
Tax History
| Year | Tax Paid | Tax Assessment Tax Assessment Total Assessment is a certain percentage of the fair market value that is determined by local assessors to be the total taxable value of land and additions on the property. | Land | Improvement |
|---|---|---|---|---|
| 2025 | $458 | $5,175 | $1,664 | $3,511 |
| 2023 | $458 | $4,695 | $1,544 | $3,151 |
| 2022 | $403 | $4,471 | $1,488 | $2,983 |
| 2021 | $392 | $4,258 | $1,399 | $2,859 |
| 2020 | $379 | $4,055 | $1,314 | $2,741 |
| 2019 | $362 | $3,863 | $1,203 | $2,660 |
| 2018 | $351 | $3,679 | $1,111 | $2,568 |
| 2017 | $352 | $3,679 | $1,111 | $2,568 |
| 2016 | $343 | $3,679 | $1,111 | $2,568 |
| 2015 | $354 | $3,679 | $1,111 | $2,568 |
| 2014 | $266 | $2,762 | $790 | $1,972 |
Source: Public Records
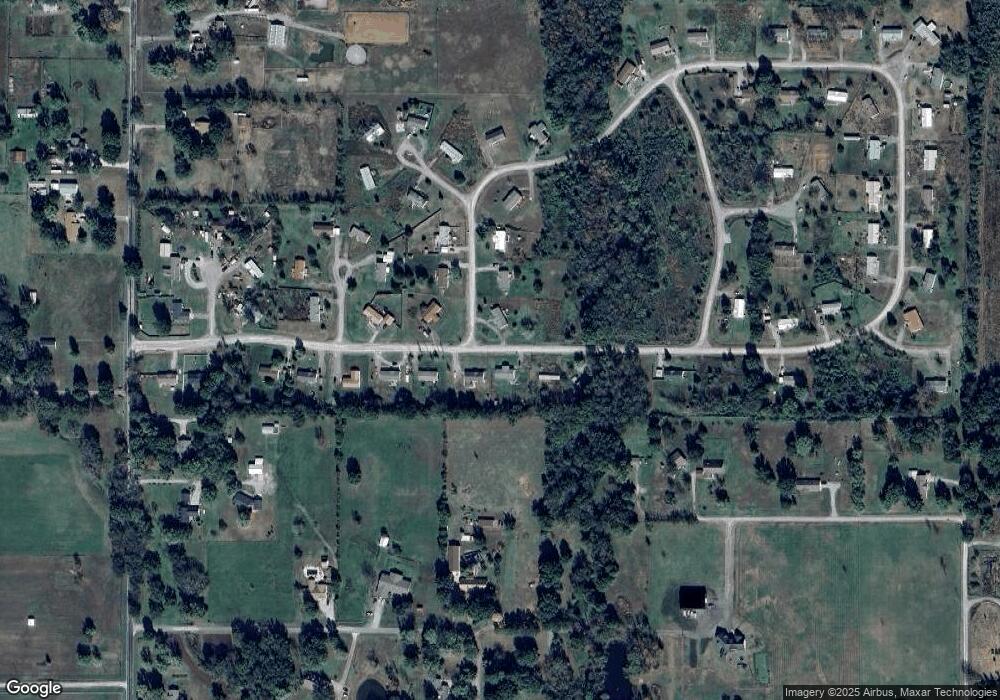
Map
Nearby Homes
- 49 Spring Creek Way
- 943 Spring Creek Rd
- 940 Spring Creek Rd
- 1049 Spring Creek Rd
- 74 Spring Creek Way
- 919 Spring Creek Rd
- 889 Spring Creek Rd
- 938 Spring Creek Rd
- 837 Spring Creek Rd
- 854 Spring Creek Rd
- 83 Spring Creek Way
- 1173 Spring Creek Rd
- 833 Spring Creek Rd
- 218 Spring Creek Way
- 1181 Spring Creek Rd
- 565 Spring Creek Rd
- 1259 Spring Creek Rd
- 60 Spring Creek Dr
- 90 Spring Creek Dr
- 39 Spring Creek Dr