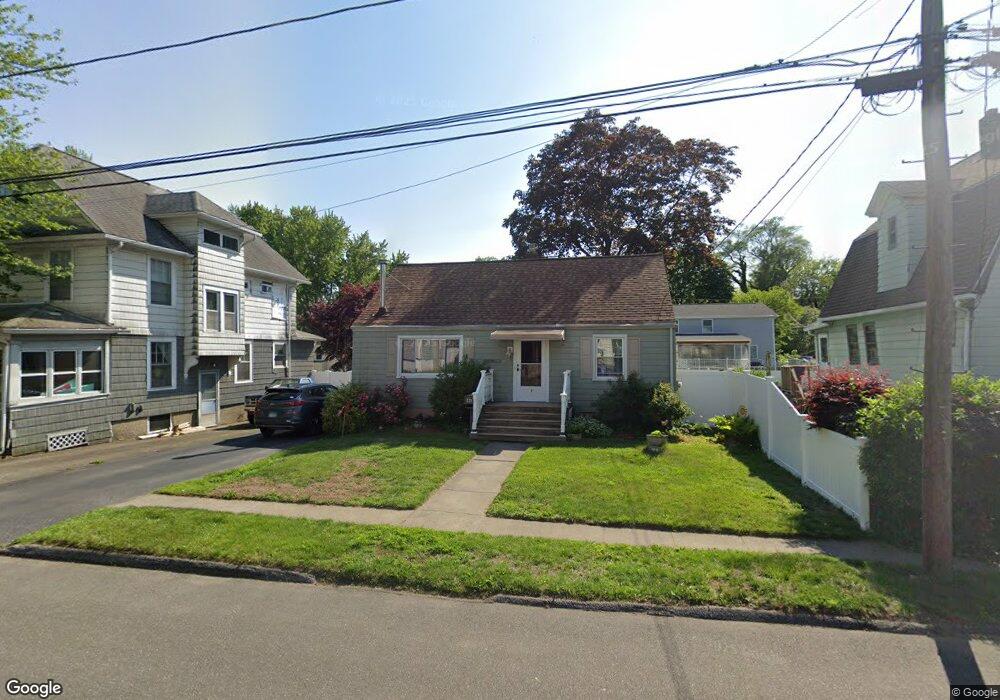
49 Spring St Milford, CT 06460
Devon NeighborhoodEstimated Value: $392,815 - $452,000
4
Beds
1
Bath
1,142
Sq Ft
$378/Sq Ft
Est. Value
About This Home
This home is located at 49 Spring St, Milford, CT 06460 and is currently estimated at $431,954, approximately $378 per square foot. 49 Spring St is a home located in New Haven County with nearby schools including J.F. Kennedy School, West Shore Middle School, and Jonathan Law High School.
Ownership History
Date
Name
Owned For
Owner Type
Purchase Details
Closed on
Nov 12, 2003
Sold by
Davis Kendra D and Davis Stephen A
Bought by
Scott Glenn D and Scott Maria N
Current Estimated Value
Purchase Details
Closed on
Jul 30, 1992
Sold by
Ward James P and Ward Linda M
Bought by
Robinson Jimmy L
Create a Home Valuation Report for This Property
The Home Valuation Report is an in-depth analysis detailing your home's value as well as a comparison with similar homes in the area
Home Values in the Area
Average Home Value in this Area
Purchase History
| Date | Buyer | Sale Price | Title Company |
|---|---|---|---|
| Scott Glenn D | $202,500 | -- | |
| Scott Glenn D | $202,500 | -- | |
| Robinson Jimmy L | $114,000 | -- | |
| Robinson Jimmy L | $114,000 | -- |
Source: Public Records
Mortgage History
| Date | Status | Borrower | Loan Amount |
|---|---|---|---|
| Open | Robinson Jimmy L | $35,000 | |
| Open | Robinson Jimmy L | $243,200 |
Source: Public Records
Tax History
| Year | Tax Paid | Tax Assessment Tax Assessment Total Assessment is a certain percentage of the fair market value that is determined by local assessors to be the total taxable value of land and additions on the property. | Land | Improvement |
|---|---|---|---|---|
| 2025 | $5,348 | $180,990 | $72,350 | $108,640 |
| 2024 | $5,274 | $180,990 | $72,350 | $108,640 |
| 2023 | $4,917 | $180,990 | $72,350 | $108,640 |
| 2022 | $4,823 | $180,990 | $72,350 | $108,640 |
| 2021 | $4,294 | $155,310 | $49,000 | $106,310 |
| 2020 | $4,299 | $155,310 | $49,000 | $106,310 |
| 2019 | $4,304 | $155,310 | $49,000 | $106,310 |
| 2018 | $4,308 | $155,310 | $49,000 | $106,310 |
| 2017 | $4,316 | $155,310 | $49,000 | $106,310 |
| 2016 | $4,262 | $153,090 | $49,000 | $104,090 |
| 2015 | $4,268 | $153,090 | $49,000 | $104,090 |
| 2014 | $4,167 | $153,090 | $49,000 | $104,090 |
Source: Public Records
Map
Nearby Homes
Your Personal Tour Guide
Ask me questions while you tour the home.