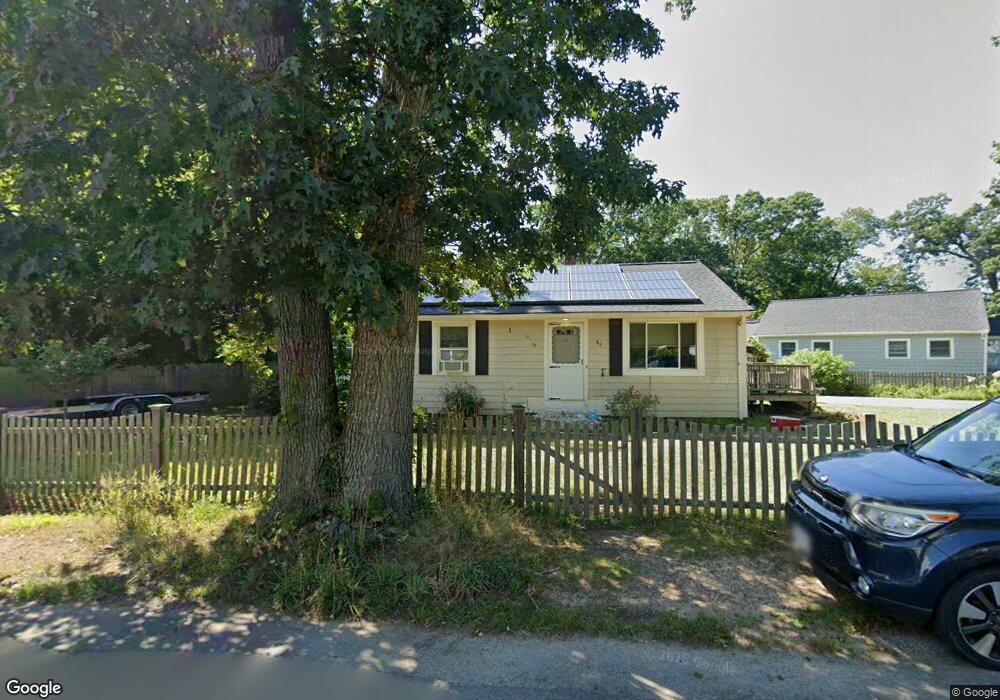
49 Stevens Rd Marshfield, MA 02050
Green Harbor-Cedar Crest NeighborhoodEstimated Value: $554,002 - $643,000
3
Beds
1
Bath
1,200
Sq Ft
$492/Sq Ft
Est. Value
About This Home
This home is located at 49 Stevens Rd, Marshfield, MA 02050 and is currently estimated at $590,501, approximately $492 per square foot. 49 Stevens Rd is a home located in Plymouth County with nearby schools including Governor Edward Winslow School, Furnace Brook Middle School, and Marshfield High School.
Ownership History
Date
Name
Owned For
Owner Type
Purchase Details
Closed on
May 31, 2000
Sold by
Popoloski Mark E and Popoloski Sandra M
Bought by
Child Brian G and Child Kristen F
Current Estimated Value
Purchase Details
Closed on
Oct 29, 1998
Sold by
Caswell David A and Caswell Joan
Bought by
Popoloski Mark E and Popoloski Sandra M
Purchase Details
Closed on
Jun 11, 1990
Sold by
Cahill Ann R Est
Bought by
Caswell David A
Create a Home Valuation Report for This Property
The Home Valuation Report is an in-depth analysis detailing your home's value as well as a comparison with similar homes in the area
Home Values in the Area
Average Home Value in this Area
Purchase History
| Date | Buyer | Sale Price | Title Company |
|---|---|---|---|
| Child Brian G | $177,500 | -- | |
| Child Brian G | $177,500 | -- | |
| Popoloski Mark E | $132,500 | -- | |
| Popoloski Mark E | $132,500 | -- | |
| Caswell David A | $118,000 | -- |
Source: Public Records
Mortgage History
| Date | Status | Borrower | Loan Amount |
|---|---|---|---|
| Open | Caswell David A | $341,519 | |
| Closed | Caswell David A | $336,472 |
Source: Public Records
Tax History
| Year | Tax Paid | Tax Assessment Tax Assessment Total Assessment is a certain percentage of the fair market value that is determined by local assessors to be the total taxable value of land and additions on the property. | Land | Improvement |
|---|---|---|---|---|
| 2025 | $4,643 | $469,000 | $260,500 | $208,500 |
| 2024 | $4,522 | $435,200 | $250,500 | $184,700 |
| 2023 | $4,411 | $399,200 | $230,500 | $168,700 |
| 2022 | $4,411 | $340,600 | $200,400 | $140,200 |
| 2021 | $4,336 | $328,700 | $200,400 | $128,300 |
| 2020 | $4,212 | $316,000 | $190,400 | $125,600 |
| 2019 | $4,034 | $301,500 | $190,400 | $111,100 |
| 2018 | $3,979 | $297,600 | $190,400 | $107,200 |
| 2017 | $3,848 | $280,500 | $180,400 | $100,100 |
| 2016 | $3,748 | $270,000 | $180,400 | $89,600 |
| 2015 | $3,483 | $262,100 | $180,400 | $81,700 |
| 2014 | $3,435 | $258,500 | $180,400 | $78,100 |
Source: Public Records
Map
Nearby Homes
- 106 Careswell St
- 71 Gurnet Rd
- 98 Cherry St
- 122 June St
- 116 Island St
- 78 Tower Ave
- 116 Outlook Rd
- 17 Dyke Rd
- 256 Ocean St
- 86 Barouche Dr
- 32 Gratto Rd
- 568 Webster St
- 39 Bay Pond Rd
- 42 Carr Rd
- 387 Lot 2A Old Cove Rd
- 387 Lot 3A Old Cove Rd
- 387 Lot 4A Old Cove Rd
- 236 Powder Point Ave
- 30 Chandler Dr
- 242 Enterprise St
Your Personal Tour Guide
Ask me questions while you tour the home.