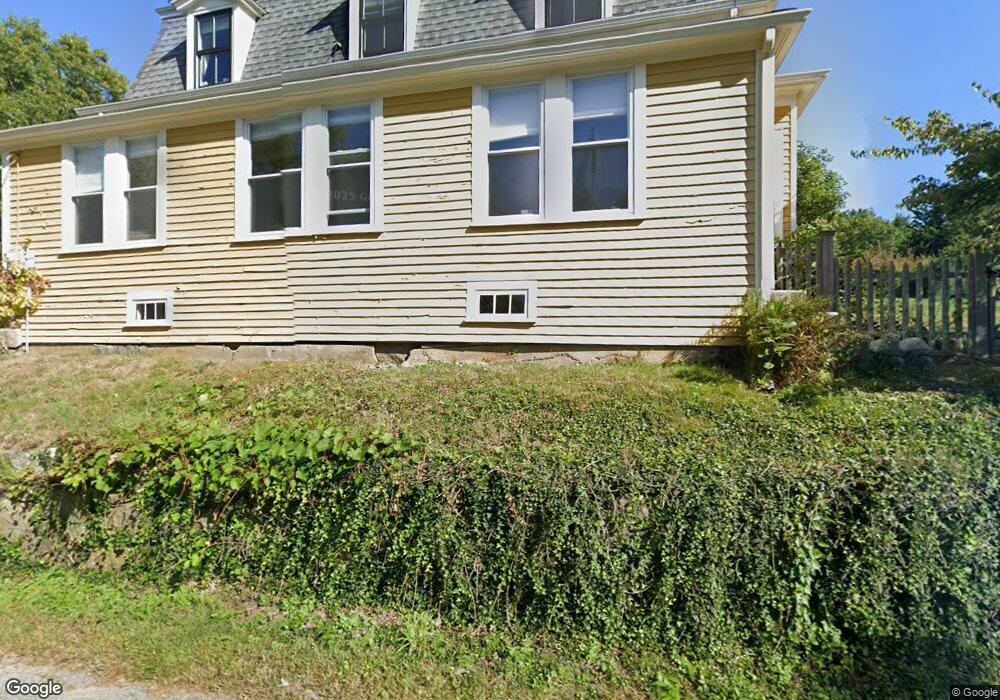
49 Sumner St Gloucester, MA 01930
West Gloucester NeighborhoodEstimated Value: $810,000 - $985,000
3
Beds
3
Baths
2,300
Sq Ft
$381/Sq Ft
Est. Value
About This Home
This home is located at 49 Sumner St, Gloucester, MA 01930 and is currently estimated at $875,899, approximately $380 per square foot. 49 Sumner St is a home located in Essex County with nearby schools including West Parish, Ralph B O'maley Middle School, and Gloucester High School.
Ownership History
Date
Name
Owned For
Owner Type
Purchase Details
Closed on
Jun 3, 2008
Sold by
Harrison James F and Harrison Karen U
Bought by
Harrison Karen U
Current Estimated Value
Purchase Details
Closed on
Oct 22, 2004
Sold by
Seng Jordan G and Seng Sonya M
Bought by
Harrison Karen U and Harrison James F
Purchase Details
Closed on
Mar 22, 2002
Sold by
Durgin Paula A
Bought by
Seng Jordan G and Seng Sonya M
Purchase Details
Closed on
Dec 30, 1996
Sold by
Nevin Bruce E and Nevin Sarah S
Bought by
Durgin Paula A
Purchase Details
Closed on
Sep 24, 1996
Sold by
Nevin Bruce E and Nevin Sarah S
Bought by
Gustafson Keith A and Gustafson Tina
Purchase Details
Closed on
May 6, 1987
Sold by
Roberts Adm Ronald
Bought by
Nevin Bruce E
Create a Home Valuation Report for This Property
The Home Valuation Report is an in-depth analysis detailing your home's value as well as a comparison with similar homes in the area
Home Values in the Area
Average Home Value in this Area
Purchase History
| Date | Buyer | Sale Price | Title Company |
|---|---|---|---|
| Harrison Karen U | -- | -- | |
| Harrison Karen U | $475,000 | -- | |
| Seng Jordan G | $331,500 | -- | |
| Durgin Paula A | $192,000 | -- | |
| Gustafson Keith A | $119,000 | -- | |
| Nevin Bruce E | $175,000 | -- |
Source: Public Records
Mortgage History
| Date | Status | Borrower | Loan Amount |
|---|---|---|---|
| Open | Nevin Bruce E | $50,000 | |
| Open | Nevin Bruce E | $187,000 |
Source: Public Records
Tax History
| Year | Tax Paid | Tax Assessment Tax Assessment Total Assessment is a certain percentage of the fair market value that is determined by local assessors to be the total taxable value of land and additions on the property. | Land | Improvement |
|---|---|---|---|---|
| 2025 | $7,668 | $788,900 | $222,300 | $566,600 |
| 2024 | $7,573 | $778,300 | $211,700 | $566,600 |
| 2023 | $7,247 | $684,300 | $189,000 | $495,300 |
| 2022 | $7,020 | $598,500 | $164,300 | $434,200 |
| 2021 | $6,780 | $545,000 | $149,500 | $395,500 |
| 2020 | $6,796 | $551,200 | $149,500 | $401,700 |
| 2019 | $6,543 | $515,600 | $149,500 | $366,100 |
| 2018 | $6,351 | $491,200 | $149,500 | $341,700 |
| 2017 | $6,152 | $466,400 | $142,300 | $324,100 |
| 2016 | $6,044 | $444,100 | $148,400 | $295,700 |
| 2015 | $4,823 | $353,300 | $148,400 | $204,900 |
Source: Public Records
Map
Nearby Homes
- 7 Leaman Dr
- 587 Essex Ave
- 15 Lufkin Point Rd
- 368 Essex Ave
- 162 Main St
- 145 Main St Unit 1
- 145 Main St Unit 4
- 90 Southern Ave Unit 90
- 5 Samoset Rd Unit B
- 167 Atlantic St
- 178 Atlantic St
- 5 Lepage Ln
- 24 Cobblestone Ln Unit 603
- 226 Atlantic St
- 34 & 34R Pickering St
- 145 Essex Ave Unit 402
- 13 Honeysuckle Rd
- 85 Martin St
- 3 Hardy Ln
- 2 Breezy Point Rd
Your Personal Tour Guide
Ask me questions while you tour the home.