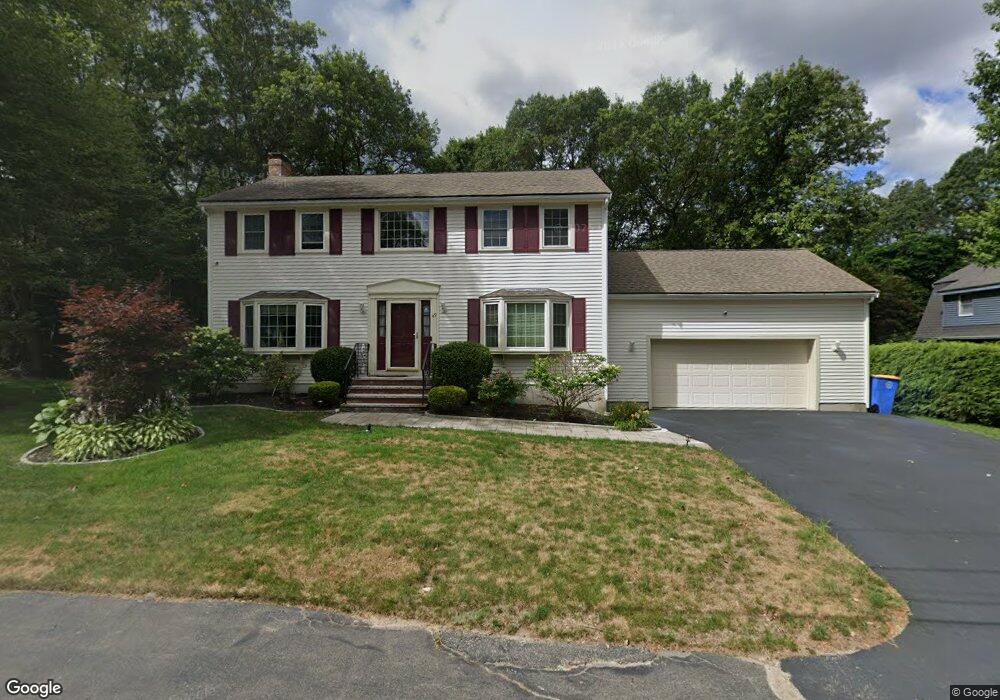
49 Tiffany Dr Randolph, MA 02368
Downtown Randolph NeighborhoodEstimated Value: $781,000 - $916,000
3
Beds
3
Baths
2,128
Sq Ft
$390/Sq Ft
Est. Value
About This Home
This home is located at 49 Tiffany Dr, Randolph, MA 02368 and is currently estimated at $829,303, approximately $389 per square foot. 49 Tiffany Dr is a home located in Norfolk County with nearby schools including Randolph High School and Lighthouse Baptist Christian Academy.
Ownership History
Date
Name
Owned For
Owner Type
Purchase Details
Closed on
Dec 10, 2010
Sold by
Annese Ft
Bought by
Pamphile Jean Y and Pamphile Adelle
Current Estimated Value
Home Financials for this Owner
Home Financials are based on the most recent Mortgage that was taken out on this home.
Original Mortgage
$361,075
Outstanding Balance
$238,798
Interest Rate
4.24%
Mortgage Type
Purchase Money Mortgage
Estimated Equity
$590,505
Purchase Details
Closed on
Aug 18, 2006
Sold by
Annese Anthony and Annese Mary A
Bought by
Annese Ft
Purchase Details
Closed on
May 8, 1995
Sold by
Colchester Dev Inc
Bought by
Annese Anthony and Annese Mary A
Home Financials for this Owner
Home Financials are based on the most recent Mortgage that was taken out on this home.
Original Mortgage
$100,000
Interest Rate
8.36%
Mortgage Type
Purchase Money Mortgage
Create a Home Valuation Report for This Property
The Home Valuation Report is an in-depth analysis detailing your home's value as well as a comparison with similar homes in the area
Home Values in the Area
Average Home Value in this Area
Purchase History
| Date | Buyer | Sale Price | Title Company |
|---|---|---|---|
| Pamphile Jean Y | $382,500 | -- | |
| Annese Ft | -- | -- | |
| Annese Anthony | $213,000 | -- |
Source: Public Records
Mortgage History
| Date | Status | Borrower | Loan Amount |
|---|---|---|---|
| Open | Pamphile Jean Y | $361,075 | |
| Previous Owner | Annese Anthony | $100,000 |
Source: Public Records
Tax History Compared to Growth
Tax History
| Year | Tax Paid | Tax Assessment Tax Assessment Total Assessment is a certain percentage of the fair market value that is determined by local assessors to be the total taxable value of land and additions on the property. | Land | Improvement |
|---|---|---|---|---|
| 2025 | $8,860 | $763,100 | $267,000 | $496,100 |
| 2024 | $7,120 | $621,800 | $261,700 | $360,100 |
| 2023 | $7,904 | $654,300 | $238,100 | $416,200 |
| 2022 | $7,084 | $520,900 | $198,500 | $322,400 |
| 2021 | $6,885 | $465,800 | $165,400 | $300,400 |
| 2020 | $7,133 | $478,400 | $165,400 | $313,000 |
| 2019 | $6,762 | $451,400 | $157,400 | $294,000 |
| 2018 | $6,960 | $438,300 | $143,100 | $295,200 |
| 2017 | $6,626 | $409,500 | $136,200 | $273,300 |
| 2016 | $6,516 | $374,700 | $123,900 | $250,800 |
| 2015 | $6,317 | $349,000 | $118,000 | $231,000 |
Source: Public Records
Map
Nearby Homes
- 24 Cole Terrace
- 40 Linden Park Dr
- 20 Selwyn Rd
- 30 Hemlock Terrace
- 59 Highland Glen Dr Unit 328
- 159 Bittersweet Ln Unit 107
- 65 Lheureux Cir
- 631 Page St
- 4 Lori Ln
- 17 Mazzeo Dr
- 503 Page St
- 46 Union Square Unit 46
- 15 Barbara Rd
- 28 Silver St
- 545 Page St Unit 208
- 9 Madison Ave
- 12 Cottage St
- 43 Ledgebrook Ave
- 47 West St Unit A2
- 314 South St