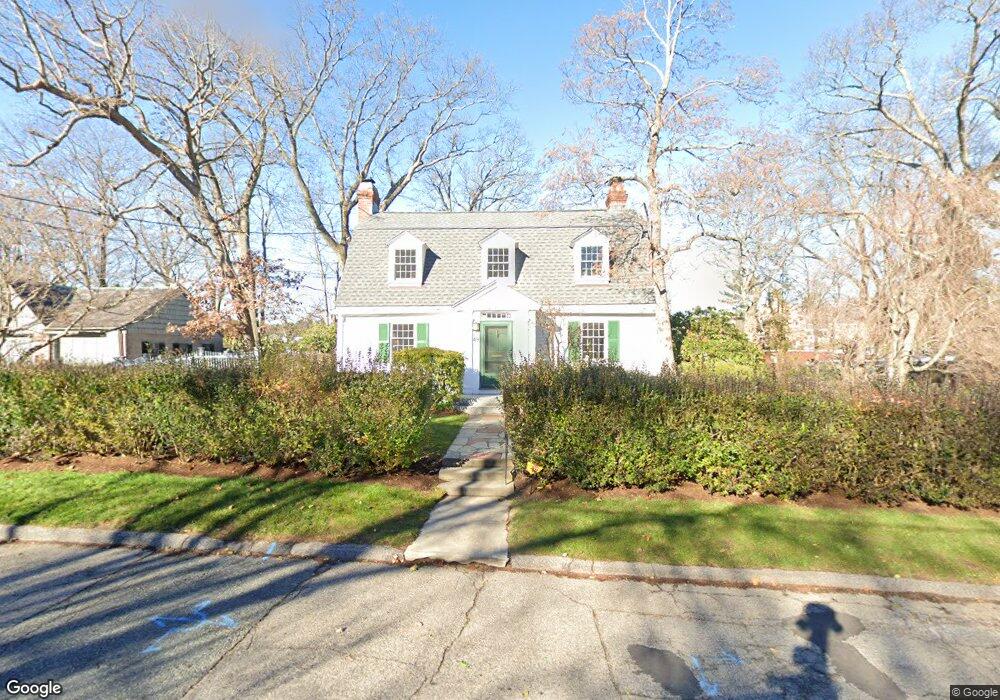
49 Tyler Rd Belmont, MA 02478
Belmont Hill NeighborhoodEstimated Value: $2,072,215 - $2,513,000
4
Beds
4
Baths
2,548
Sq Ft
$879/Sq Ft
Est. Value
About This Home
This home is located at 49 Tyler Rd, Belmont, MA 02478 and is currently estimated at $2,240,304, approximately $879 per square foot. 49 Tyler Rd is a home located in Middlesex County with nearby schools including Winn Brook Elementary School, Winthrop L Chenery Middle School, and Belmont High School.
Ownership History
Date
Name
Owned For
Owner Type
Purchase Details
Closed on
May 3, 2017
Sold by
Howe Reginald H
Bought by
Behn Mark and Behn Elizabeth
Current Estimated Value
Home Financials for this Owner
Home Financials are based on the most recent Mortgage that was taken out on this home.
Original Mortgage
$400,000
Outstanding Balance
$333,829
Interest Rate
4.23%
Mortgage Type
New Conventional
Estimated Equity
$1,906,475
Purchase Details
Closed on
Jan 5, 2012
Sold by
Howe Sadie H Est
Bought by
Behn Mark and Behn Elizabeth
Create a Home Valuation Report for This Property
The Home Valuation Report is an in-depth analysis detailing your home's value as well as a comparison with similar homes in the area
Home Values in the Area
Average Home Value in this Area
Purchase History
| Date | Buyer | Sale Price | Title Company |
|---|---|---|---|
| Behn Mark | $400,000 | -- | |
| Behn Mark | $900,000 | -- |
Source: Public Records
Mortgage History
| Date | Status | Borrower | Loan Amount |
|---|---|---|---|
| Open | Behn Mark | $400,000 |
Source: Public Records
Tax History Compared to Growth
Tax History
| Year | Tax Paid | Tax Assessment Tax Assessment Total Assessment is a certain percentage of the fair market value that is determined by local assessors to be the total taxable value of land and additions on the property. | Land | Improvement |
|---|---|---|---|---|
| 2025 | $23,429 | $2,057,000 | $1,090,000 | $967,000 |
| 2024 | $20,740 | $1,964,000 | $1,196,000 | $768,000 |
| 2023 | $20,513 | $1,825,000 | $1,129,000 | $696,000 |
| 2022 | $18,210 | $1,683,000 | $1,033,000 | $650,000 |
| 2021 | $18,210 | $1,578,000 | $1,037,000 | $541,000 |
| 2020 | $17,105 | $1,555,000 | $1,014,000 | $541,000 |
| 2019 | $13,934 | $1,194,000 | $706,000 | $488,000 |
| 2018 | $12,648 | $1,041,000 | $669,000 | $372,000 |
| 2017 | $12,500 | $985,000 | $613,000 | $372,000 |
| 2016 | $12,334 | $982,000 | $613,000 | $369,000 |
| 2015 | $12,423 | $963,000 | $594,000 | $369,000 |
Source: Public Records
Map
Nearby Homes
- 170 Clifton St
- 24 Bellington St
- 77 Wellesley Rd
- 135 Marsh St
- 789 Concord Turnpike
- 51 Stella Rd
- 33 Wellington Ln
- 53 Crestview Rd
- 560 Concord Ave
- 34 Woodbine Rd
- 39 Chester St
- 125 Claflin St
- 23 Centre Ave
- 26 Centre Ave
- 278 Hillside Ave
- 10 Radcliffe Rd
- 221 Highland Ave
- 305 Park Ave
- 152 Scituate St
- 18 Morton Rd