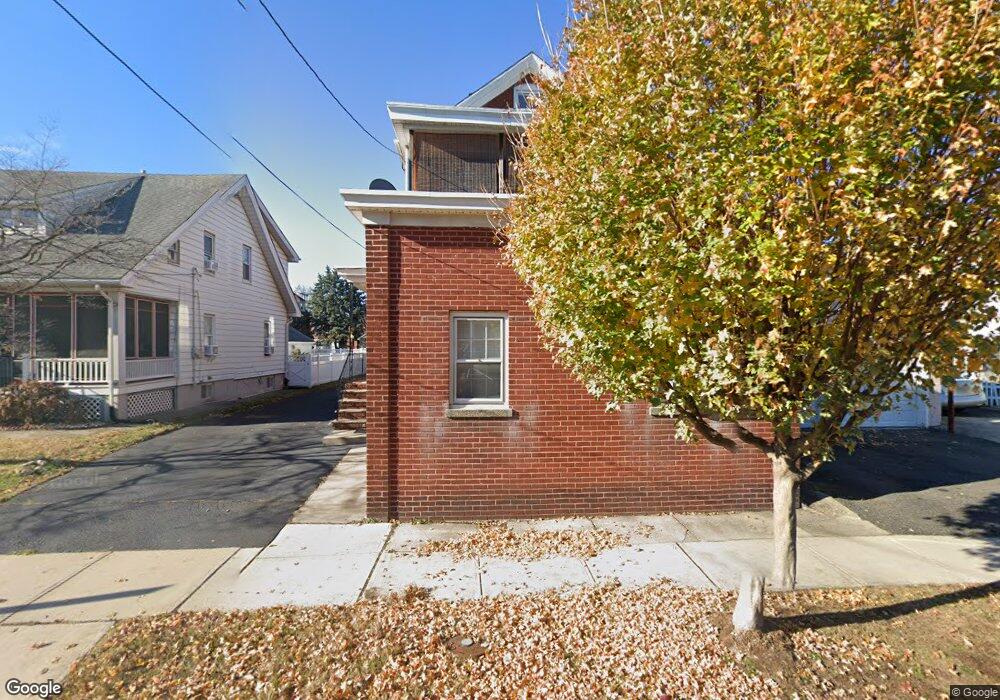
49 van Keuren Ave Bound Brook, NJ 08805
Estimated Value: $532,000 - $624,000
--
Bed
--
Bath
2,260
Sq Ft
$254/Sq Ft
Est. Value
About This Home
This home is located at 49 van Keuren Ave, Bound Brook, NJ 08805 and is currently estimated at $574,517, approximately $254 per square foot. 49 van Keuren Ave is a home located in Somerset County with nearby schools including LaMonte Annex Elementary School, Lafayette Elementary School, and Bound Brook High School.
Ownership History
Date
Name
Owned For
Owner Type
Purchase Details
Closed on
May 29, 2008
Sold by
Kaplan Phyllis
Bought by
Kaplan Phyllis and Kaplan Richard
Current Estimated Value
Home Financials for this Owner
Home Financials are based on the most recent Mortgage that was taken out on this home.
Original Mortgage
$200,000
Outstanding Balance
$43,228
Interest Rate
5.91%
Mortgage Type
New Conventional
Estimated Equity
$531,289
Purchase Details
Closed on
May 14, 2003
Sold by
Farheen Masood
Bought by
Kaplan Phyllis
Home Financials for this Owner
Home Financials are based on the most recent Mortgage that was taken out on this home.
Original Mortgage
$217,250
Interest Rate
5.84%
Purchase Details
Closed on
Dec 4, 2001
Sold by
Newhall Robert
Bought by
Farheen Masood
Home Financials for this Owner
Home Financials are based on the most recent Mortgage that was taken out on this home.
Original Mortgage
$154,400
Interest Rate
6.6%
Create a Home Valuation Report for This Property
The Home Valuation Report is an in-depth analysis detailing your home's value as well as a comparison with similar homes in the area
Home Values in the Area
Average Home Value in this Area
Purchase History
| Date | Buyer | Sale Price | Title Company |
|---|---|---|---|
| Kaplan Phyllis | -- | Trans County Title Agency Ll | |
| Kaplan Phyllis | $289,700 | -- | |
| Farheen Masood | $193,000 | -- |
Source: Public Records
Mortgage History
| Date | Status | Borrower | Loan Amount |
|---|---|---|---|
| Open | Kaplan Phyllis | $200,000 | |
| Closed | Kaplan Phyllis | $217,250 | |
| Previous Owner | Farheen Masood | $154,400 |
Source: Public Records
Tax History Compared to Growth
Tax History
| Year | Tax Paid | Tax Assessment Tax Assessment Total Assessment is a certain percentage of the fair market value that is determined by local assessors to be the total taxable value of land and additions on the property. | Land | Improvement |
|---|---|---|---|---|
| 2025 | $10,326 | $483,600 | $174,800 | $308,800 |
| 2024 | $10,326 | $455,100 | $154,800 | $300,300 |
| 2023 | $9,974 | $423,000 | $129,800 | $293,200 |
| 2022 | $9,549 | $383,800 | $104,800 | $279,000 |
| 2021 | $11,223 | $329,800 | $74,800 | $255,000 |
| 2020 | $8,820 | $285,700 | $54,800 | $230,900 |
| 2019 | $11,223 | $346,700 | $34,800 | $311,900 |
| 2018 | $9,319 | $279,500 | $34,800 | $244,700 |
| 2017 | $9,387 | $275,200 | $34,800 | $240,400 |
| 2016 | $9,085 | $268,300 | $14,800 | $253,500 |
| 2015 | $8,734 | $263,800 | $14,800 | $249,000 |
| 2014 | $9,043 | $263,800 | $14,800 | $249,000 |
Source: Public Records
Map
Nearby Homes
- 40 van Keuren Ave Unit 42
- 34 van Keuren Ave Unit 38
- 130 W High St Unit 132
- 162 Linden Ave
- 126 W High St
- 102 W Franklin St
- 2 Drake St
- 105 La Monte Ave
- 307 W Union Ave
- 432 Talmage Ave
- 320 Church St
- 512 W 2nd St
- 542 Wheatland Ave
- 510 Dalay Place
- 520 Winsor St
- 112-114 E Union Ave
- 112 E Union Ave
- 14 E Maple Ave
- 563 Winsor St
- 606 Vosseller Ave
- 47 van Keuren Ave
- 207 W 2nd St
- 39 van Keuren Ave
- 201 W 2nd St
- 148 Vosseller Ave
- 35 van Keuren Ave
- 142 Vosseller Ave
- 33 van Keuren Ave
- 52 van Keuren Ave
- 138 Vosseller Ave
- 50 van Keuren Ave
- 46 van Keuren Ave Fl 2
- 29 van Keuren Ave
- 134 Vosseller Ave
- 27 van Keuren Ave
- 109 W 2nd St
- 208 W 2nd St
- 202 W 2nd St
- 30 van Keuren Ave Unit 32
- 212 W 2nd St