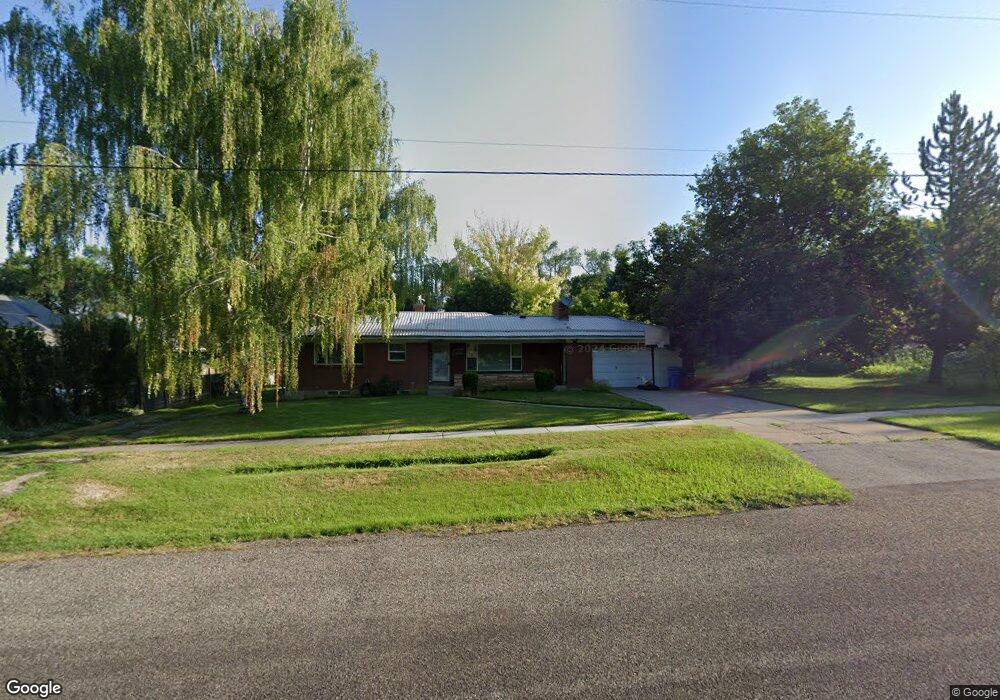
49 W 100 S Providence, UT 84332
Estimated Value: $442,000 - $458,846
4
Beds
1
Bath
2,390
Sq Ft
$187/Sq Ft
Est. Value
About This Home
This home is located at 49 W 100 S, Providence, UT 84332 and is currently estimated at $447,212, approximately $187 per square foot. 49 W 100 S is a home located in Cache County with nearby schools including Providence School, Spring Creek Middle School, and South Cache Middle School.
Ownership History
Date
Name
Owned For
Owner Type
Purchase Details
Closed on
Dec 27, 2018
Sold by
Anderson Randy
Bought by
Anderson Randy and Randy Anderson Revocable Trust
Current Estimated Value
Purchase Details
Closed on
Apr 23, 2010
Sold by
Riggs Kathy L
Bought by
Anderson Randy
Home Financials for this Owner
Home Financials are based on the most recent Mortgage that was taken out on this home.
Original Mortgage
$118,000
Outstanding Balance
$78,051
Interest Rate
4.94%
Mortgage Type
New Conventional
Estimated Equity
$369,161
Purchase Details
Closed on
Feb 19, 2010
Sold by
Riggs Kathy L
Bought by
Riggs Kathy L and Cronquist Cindy
Purchase Details
Closed on
May 22, 2006
Sold by
Riggs Louis B
Bought by
Riggs Louis B and Riggs Kathy Lee
Create a Home Valuation Report for This Property
The Home Valuation Report is an in-depth analysis detailing your home's value as well as a comparison with similar homes in the area
Home Values in the Area
Average Home Value in this Area
Purchase History
| Date | Buyer | Sale Price | Title Company |
|---|---|---|---|
| Anderson Randy | -- | None Available | |
| Anderson Randy | -- | American Secure Title | |
| Anderson Randy | -- | American Secure Title | |
| Riggs Kathy L | -- | None Available | |
| Riggs Louis B | -- | Accommodation |
Source: Public Records
Mortgage History
| Date | Status | Borrower | Loan Amount |
|---|---|---|---|
| Open | Anderson Randy | $118,000 | |
| Closed | Anderson Randy | $118,000 |
Source: Public Records
Tax History Compared to Growth
Tax History
| Year | Tax Paid | Tax Assessment Tax Assessment Total Assessment is a certain percentage of the fair market value that is determined by local assessors to be the total taxable value of land and additions on the property. | Land | Improvement |
|---|---|---|---|---|
| 2025 | $1,968 | $275,860 | $0 | $0 |
| 2024 | $2,124 | $277,100 | $0 | $0 |
| 2023 | $2,239 | $275,175 | $0 | $0 |
| 2022 | $1,942 | $225,400 | $0 | $0 |
| 2021 | $1,871 | $310,570 | $63,250 | $247,320 |
| 2020 | $1,709 | $259,750 | $63,250 | $196,500 |
| 2019 | $1,806 | $259,750 | $63,250 | $196,500 |
| 2018 | $1,450 | $209,602 | $63,250 | $146,352 |
| 2017 | $1,353 | $114,180 | $0 | $0 |
| 2016 | $1,368 | $114,180 | $0 | $0 |
| 2015 | $1,354 | $112,780 | $0 | $0 |
| 2014 | $1,321 | $112,780 | $0 | $0 |
| 2013 | -- | $112,450 | $0 | $0 |
Source: Public Records
Map
Nearby Homes