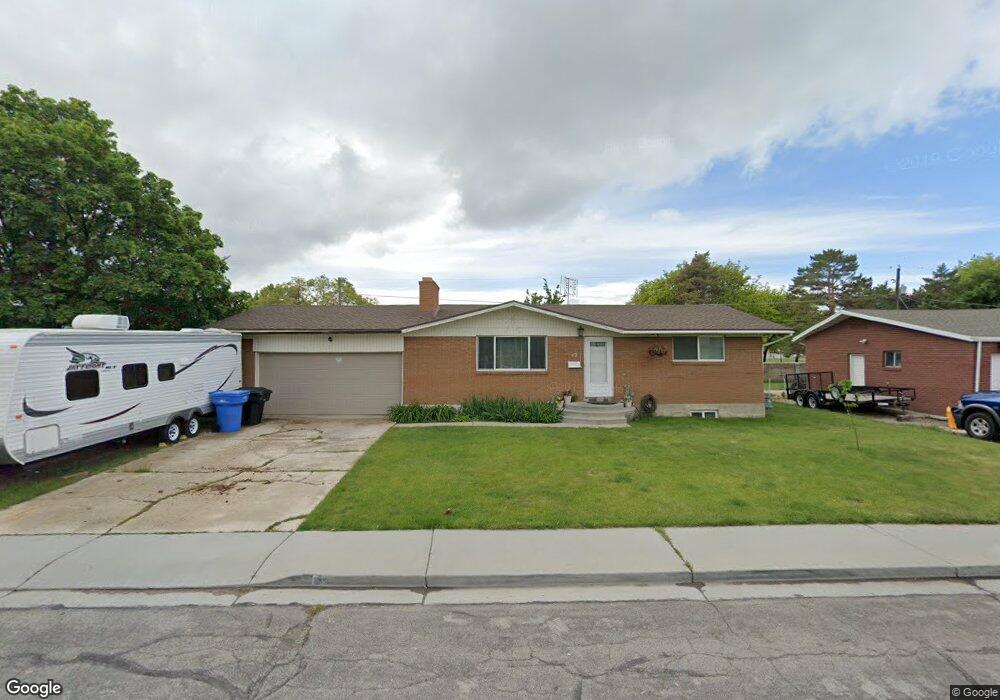
49 W 1040 S Orem, UT 84058
Westmore NeighborhoodEstimated Value: $468,000 - $509,898
4
Beds
2
Baths
1,990
Sq Ft
$242/Sq Ft
Est. Value
About This Home
This home is located at 49 W 1040 S, Orem, UT 84058 and is currently estimated at $482,299, approximately $242 per square foot. 49 W 1040 S is a home located in Utah County with nearby schools including Westmore Elementary School, Lakeridge Jr High School, and Mountain View High School.
Ownership History
Date
Name
Owned For
Owner Type
Purchase Details
Closed on
Oct 22, 2009
Sold by
Moore Tiffany B
Bought by
Smith Jared N and Smith Heidi C
Current Estimated Value
Home Financials for this Owner
Home Financials are based on the most recent Mortgage that was taken out on this home.
Original Mortgage
$123,200
Outstanding Balance
$80,324
Interest Rate
5.05%
Mortgage Type
New Conventional
Estimated Equity
$401,975
Purchase Details
Closed on
Mar 13, 2003
Sold by
Black Sandra L
Bought by
Moore Tiffany B
Home Financials for this Owner
Home Financials are based on the most recent Mortgage that was taken out on this home.
Original Mortgage
$115,200
Interest Rate
6.87%
Purchase Details
Closed on
Sep 28, 1998
Sold by
Stephens Kenneth D
Bought by
Black Sandra L
Home Financials for this Owner
Home Financials are based on the most recent Mortgage that was taken out on this home.
Original Mortgage
$117,500
Interest Rate
6.88%
Create a Home Valuation Report for This Property
The Home Valuation Report is an in-depth analysis detailing your home's value as well as a comparison with similar homes in the area
Home Values in the Area
Average Home Value in this Area
Purchase History
| Date | Buyer | Sale Price | Title Company |
|---|---|---|---|
| Smith Jared N | -- | Inwest Title Services Inc | |
| Moore Tiffany B | -- | Provo Land Title Company | |
| Black Sandra L | -- | -- |
Source: Public Records
Mortgage History
| Date | Status | Borrower | Loan Amount |
|---|---|---|---|
| Open | Smith Jared N | $123,200 | |
| Previous Owner | Moore Tiffany B | $115,200 | |
| Previous Owner | Black Sandra L | $117,500 | |
| Closed | Moore Tiffany B | $28,800 |
Source: Public Records
Tax History
| Year | Tax Paid | Tax Assessment Tax Assessment Total Assessment is a certain percentage of the fair market value that is determined by local assessors to be the total taxable value of land and additions on the property. | Land | Improvement |
|---|---|---|---|---|
| 2025 | $1,941 | $250,195 | -- | -- |
| 2024 | $1,941 | $237,380 | $0 | $0 |
| 2023 | $1,777 | $233,530 | $0 | $0 |
| 2022 | $1,760 | $224,070 | $0 | $0 |
| 2021 | $1,637 | $315,600 | $174,800 | $140,800 |
| 2020 | $1,466 | $277,800 | $139,800 | $138,000 |
| 2019 | $1,355 | $267,000 | $129,000 | $138,000 |
| 2018 | $1,265 | $238,300 | $111,100 | $127,200 |
| 2017 | $1,151 | $116,160 | $0 | $0 |
| 2016 | $1,149 | $106,920 | $0 | $0 |
| 2015 | $1,148 | $101,035 | $0 | $0 |
| 2014 | $1,136 | $99,495 | $0 | $0 |
Source: Public Records
Map
Nearby Homes
Your Personal Tour Guide
Ask me questions while you tour the home.