Estimated Value: $478,000 - $519,000
4
Beds
3
Baths
2,046
Sq Ft
$241/Sq Ft
Est. Value
About This Home
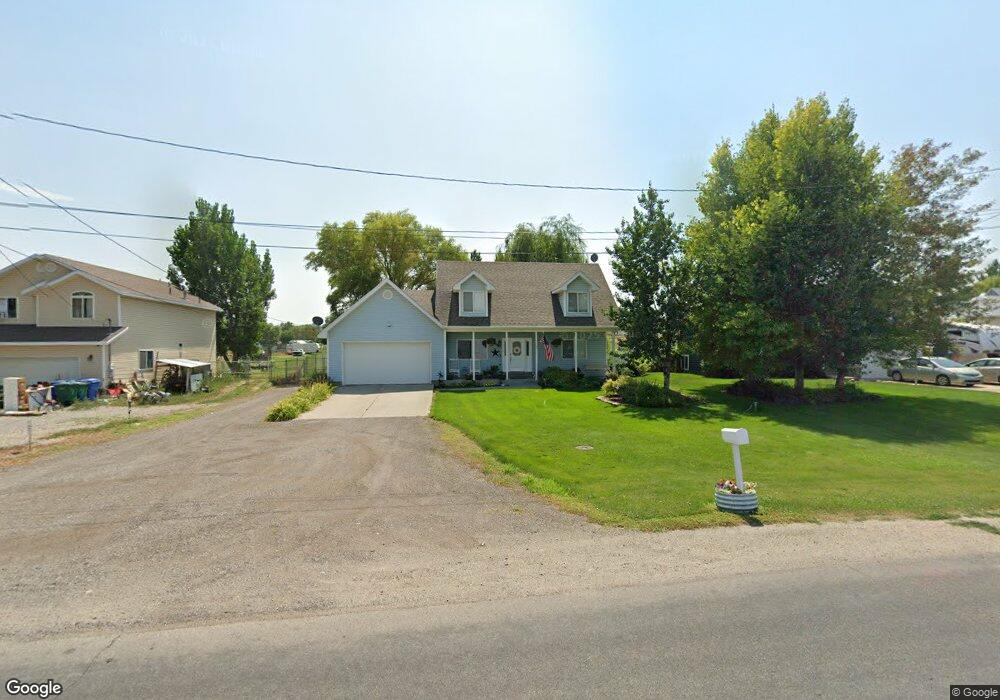
This home is located at 49 W 300 N, Hyrum, UT 84319 and is currently estimated at $492,230, approximately $240 per square foot. 49 W 300 N is a home located in Cache County with nearby schools including Lincoln School, South Cache Middle School, and Mountain Crest High School.
Ownership History
Date
Name
Owned For
Owner Type
Purchase Details
Closed on
Dec 27, 2022
Sold by
Twitchell Leslie C A
Bought by
Leslie Carol An Twitchell Living Trust
Current Estimated Value
Purchase Details
Closed on
Aug 18, 2011
Sold by
Cracroft Paul J
Bought by
Twitchell Leslie C A
Purchase Details
Closed on
May 15, 2007
Sold by
Cracroft Tiffani
Bought by
Cracroft Paul J
Purchase Details
Closed on
Oct 17, 2005
Sold by
Aaberge Tiffani C
Bought by
Cracroft Tiffani
Home Financials for this Owner
Home Financials are based on the most recent Mortgage that was taken out on this home.
Original Mortgage
$130,500
Interest Rate
5.67%
Mortgage Type
New Conventional
Purchase Details
Closed on
Aug 1, 2002
Sold by
Dalton Phyllis W and Lang Phyllis W
Bought by
Lang Steven Loyal and Lang Phyllis W
Create a Home Valuation Report for This Property
The Home Valuation Report is an in-depth analysis detailing your home's value as well as a comparison with similar homes in the area
Home Values in the Area
Average Home Value in this Area
Purchase History
| Date | Buyer | Sale Price | Title Company |
|---|---|---|---|
| Leslie Carol An Twitchell Living Trust | -- | -- | |
| Twitchell Leslie C A | -- | American Secure Title Logan | |
| Cracroft Paul J | -- | Hickman Land Title Company | |
| Cracroft Tiffani | -- | Hickman Land Title Company | |
| Lang Steven Loyal | -- | Hickman Land Title Company |
Source: Public Records
Mortgage History
| Date | Status | Borrower | Loan Amount |
|---|---|---|---|
| Previous Owner | Cracroft Tiffani | $130,500 |
Source: Public Records
Tax History Compared to Growth
Tax History
| Year | Tax Paid | Tax Assessment Tax Assessment Total Assessment is a certain percentage of the fair market value that is determined by local assessors to be the total taxable value of land and additions on the property. | Land | Improvement |
|---|---|---|---|---|
| 2025 | $1,651 | $237,025 | $0 | $0 |
| 2024 | $176 | $236,055 | $0 | $0 |
| 2023 | $1,464 | $187,665 | $0 | $0 |
| 2022 | $1,528 | $187,665 | $0 | $0 |
| 2021 | $1,518 | $287,265 | $71,490 | $215,775 |
| 2020 | $1,293 | $229,741 | $71,490 | $158,251 |
| 2019 | $1,252 | $209,121 | $50,870 | $158,251 |
| 2018 | $1,167 | $188,480 | $50,870 | $137,610 |
| 2017 | $1,155 | $96,785 | $0 | $0 |
| 2016 | $1,181 | $96,785 | $0 | $0 |
| 2015 | $947 | $77,460 | $0 | $0 |
| 2014 | $925 | $77,295 | $0 | $0 |
| 2013 | -- | $77,295 | $0 | $0 |
Source: Public Records
Map
Nearby Homes