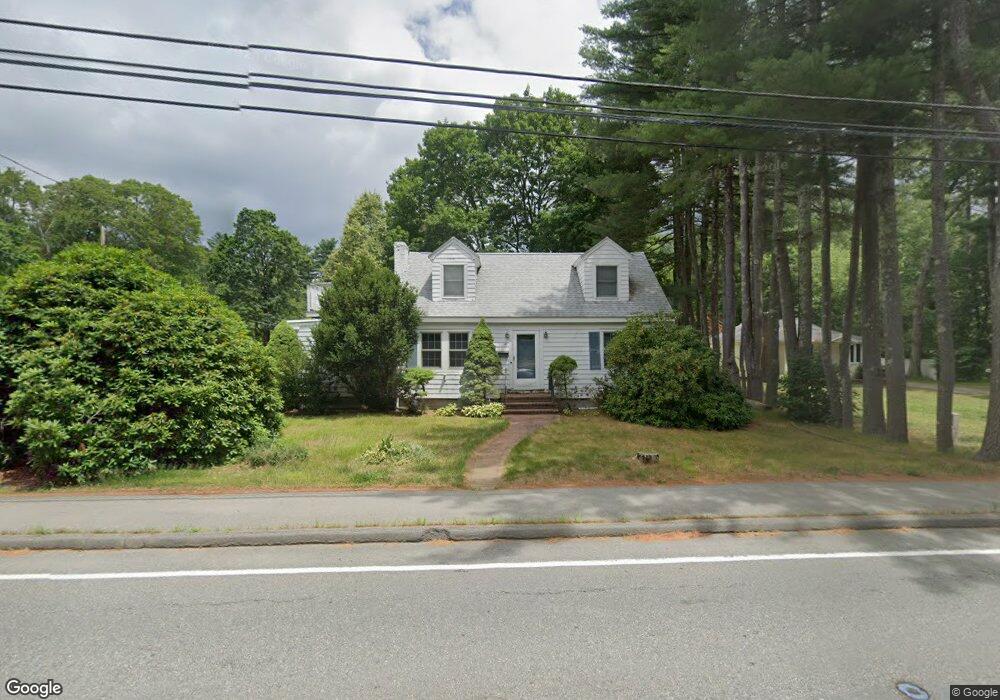
49 Walpole St Sharon, MA 02067
Estimated Value: $629,798 - $869,000
3
Beds
1
Bath
1,459
Sq Ft
$484/Sq Ft
Est. Value
About This Home
This home is located at 49 Walpole St, Sharon, MA 02067 and is currently estimated at $705,700, approximately $483 per square foot. 49 Walpole St is a home located in Norfolk County with nearby schools including Heights Elementary School, Sharon Middle School, and Sharon High School.
Ownership History
Date
Name
Owned For
Owner Type
Purchase Details
Closed on
May 20, 2013
Sold by
Gillis Heather and Coughlin Mark F
Bought by
Coughlin Mark F
Current Estimated Value
Purchase Details
Closed on
Apr 26, 2002
Sold by
Kooken Jeffrey B and Kooken Jennifer B
Bought by
Gillis Heather L
Home Financials for this Owner
Home Financials are based on the most recent Mortgage that was taken out on this home.
Original Mortgage
$234,400
Interest Rate
7.05%
Mortgage Type
Purchase Money Mortgage
Purchase Details
Closed on
Aug 10, 1998
Sold by
Dewitt William H
Bought by
Kooken Jeffrey B and Kooken Jennifer B
Home Financials for this Owner
Home Financials are based on the most recent Mortgage that was taken out on this home.
Original Mortgage
$150,320
Interest Rate
6.92%
Mortgage Type
Purchase Money Mortgage
Purchase Details
Closed on
Jan 31, 1996
Sold by
Dwyer Frances A
Bought by
Silenzi Robert P
Create a Home Valuation Report for This Property
The Home Valuation Report is an in-depth analysis detailing your home's value as well as a comparison with similar homes in the area
Home Values in the Area
Average Home Value in this Area
Purchase History
| Date | Buyer | Sale Price | Title Company |
|---|---|---|---|
| Coughlin Mark F | -- | -- | |
| Gillis Heather L | $293,000 | -- | |
| Kooken Jeffrey B | $187,900 | -- | |
| Silenzi Robert P | $127,000 | -- |
Source: Public Records
Mortgage History
| Date | Status | Borrower | Loan Amount |
|---|---|---|---|
| Previous Owner | Silenzi Robert P | $185,000 | |
| Previous Owner | Gillis Heather L | $234,400 | |
| Previous Owner | Silenzi Robert P | $150,000 | |
| Previous Owner | Silenzi Robert P | $150,320 | |
| Previous Owner | Silenzi Robert P | $104,000 |
Source: Public Records
Tax History Compared to Growth
Tax History
| Year | Tax Paid | Tax Assessment Tax Assessment Total Assessment is a certain percentage of the fair market value that is determined by local assessors to be the total taxable value of land and additions on the property. | Land | Improvement |
|---|---|---|---|---|
| 2025 | $9,111 | $521,200 | $341,100 | $180,100 |
| 2024 | $8,537 | $485,600 | $312,900 | $172,700 |
| 2023 | $8,362 | $449,800 | $292,500 | $157,300 |
| 2022 | $7,780 | $393,900 | $243,700 | $150,200 |
| 2021 | $7,594 | $371,700 | $229,900 | $141,800 |
| 2020 | $7,062 | $371,700 | $229,900 | $141,800 |
| 2019 | $6,702 | $345,300 | $203,500 | $141,800 |
| 2018 | $6,611 | $341,300 | $199,500 | $141,800 |
| 2017 | $6,439 | $328,200 | $186,400 | $141,800 |
| 2016 | $6,347 | $315,600 | $186,400 | $129,200 |
| 2015 | $5,869 | $289,100 | $171,000 | $118,100 |
| 2014 | $5,429 | $264,200 | $155,500 | $108,700 |
Source: Public Records
Map
Nearby Homes
- 27 Henry St
- 28 Norfolk Place
- 11 Webb Rd
- 630 S Main St
- 668 S Main St
- 97 Old Post Rd
- 91 Old Post Rd
- 111 E Foxboro St
- 6 Grove Ave
- 32 Gunhouse St
- 148 S Main St
- 5 Chase Dr
- 5 Trowel Pond Shop Rd Unit C
- 0 U S Route 1
- 277 Everett St
- Lot One Old Wolomolopoag St
- Lot Two Old Wolomolopoag St
- 16 Forest Rd
- 137 Pond St
- 54 Depot St