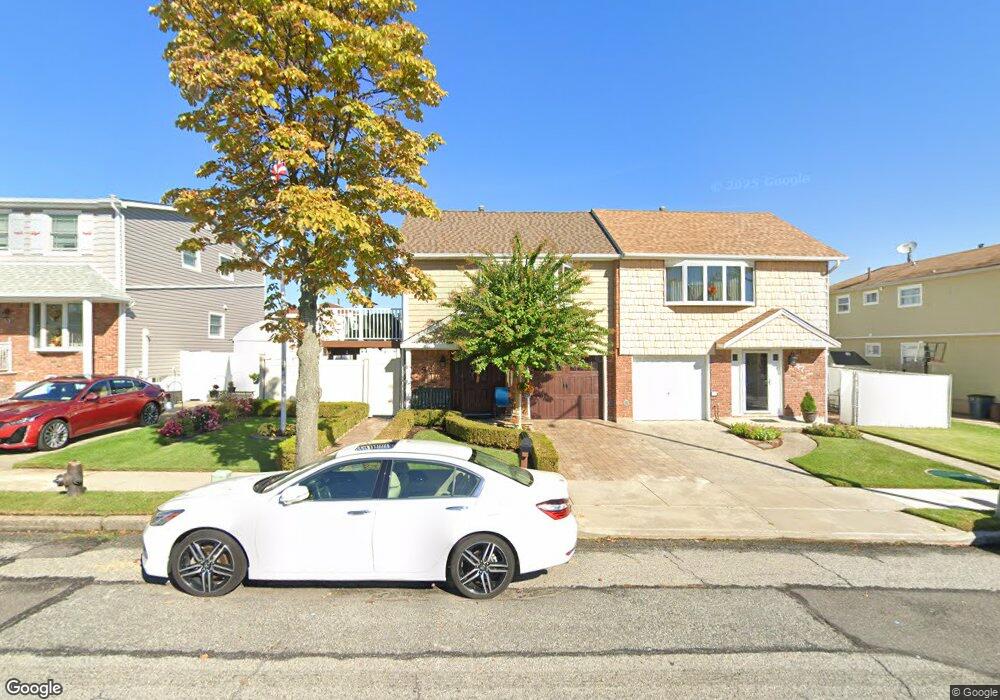
49 Watkins Ave Staten Island, NY 10312
Arden Heights NeighborhoodEstimated Value: $755,088 - $880,000
--
Bed
4
Baths
2,088
Sq Ft
$400/Sq Ft
Est. Value
About This Home
This home is located at 49 Watkins Ave, Staten Island, NY 10312 and is currently estimated at $835,022, approximately $399 per square foot. 49 Watkins Ave is a home located in Richmond County with nearby schools including P.S. 42 The Eltingville School, I.S. 075 Frank D. Paulo, and Tottenville High School.
Ownership History
Date
Name
Owned For
Owner Type
Purchase Details
Closed on
Dec 12, 2011
Sold by
Mcglyn Elizabeth A and Mcglyn Gerard F
Bought by
Mcglyn Paul and Mcglyn Family Irrevocable Trus
Current Estimated Value
Purchase Details
Closed on
May 20, 2004
Sold by
Mcglyn Elizabeth A
Bought by
Mcglyn Gerard F and Mcglyn Elizabeth A
Home Financials for this Owner
Home Financials are based on the most recent Mortgage that was taken out on this home.
Original Mortgage
$95,500
Interest Rate
6.01%
Mortgage Type
New Conventional
Create a Home Valuation Report for This Property
The Home Valuation Report is an in-depth analysis detailing your home's value as well as a comparison with similar homes in the area
Home Values in the Area
Average Home Value in this Area
Purchase History
| Date | Buyer | Sale Price | Title Company |
|---|---|---|---|
| Mcglyn Paul | -- | None Available | |
| Mcglyn Gerard F | -- | -- |
Source: Public Records
Mortgage History
| Date | Status | Borrower | Loan Amount |
|---|---|---|---|
| Previous Owner | Mcglyn Gerard F | $95,500 |
Source: Public Records
Tax History Compared to Growth
Tax History
| Year | Tax Paid | Tax Assessment Tax Assessment Total Assessment is a certain percentage of the fair market value that is determined by local assessors to be the total taxable value of land and additions on the property. | Land | Improvement |
|---|---|---|---|---|
| 2025 | $6,697 | $49,920 | $8,627 | $41,293 |
| 2024 | $6,709 | $44,940 | $9,041 | $35,899 |
| 2023 | $6,610 | $36,826 | $8,874 | $27,952 |
| 2022 | $6,440 | $41,280 | $10,800 | $30,480 |
| 2021 | $6,419 | $41,160 | $10,800 | $30,360 |
| 2020 | $6,129 | $37,980 | $10,800 | $27,180 |
| 2019 | $5,663 | $39,180 | $10,800 | $28,380 |
| 2018 | $5,371 | $30,688 | $10,025 | $20,663 |
| 2017 | $5,561 | $30,480 | $10,800 | $19,680 |
| 2016 | $5,141 | $29,016 | $10,467 | $18,549 |
| 2015 | $4,399 | $27,693 | $8,582 | $19,111 |
| 2014 | $4,399 | $26,126 | $8,767 | $17,359 |
Source: Public Records
Map
Nearby Homes