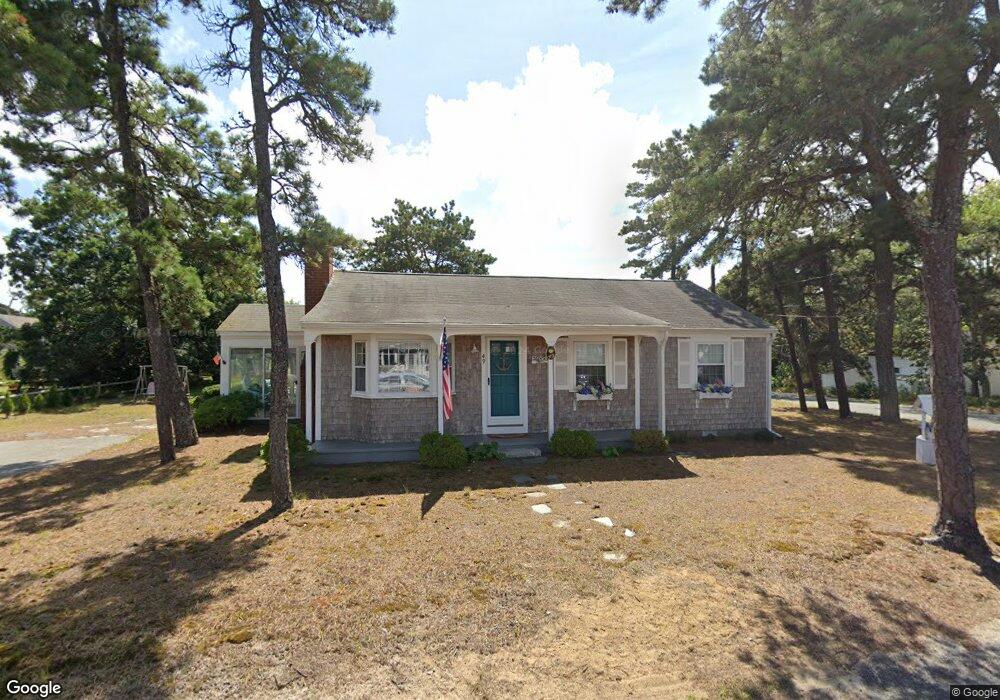
49 West St Dennis Port, MA 02639
Dennis Port NeighborhoodEstimated Value: $550,000 - $656,529
3
Beds
1
Bath
877
Sq Ft
$711/Sq Ft
Est. Value
About This Home
This home is located at 49 West St, Dennis Port, MA 02639 and is currently estimated at $623,382, approximately $710 per square foot. 49 West St is a home located in Barnstable County with nearby schools including Dennis-Yarmouth Regional High School and St. Pius X. School.
Ownership History
Date
Name
Owned For
Owner Type
Purchase Details
Closed on
May 28, 2014
Sold by
Mcconaghy Marilyn S
Bought by
Marilyn S Mcconaghy T S and Marilyn Mcconaghy
Current Estimated Value
Purchase Details
Closed on
Mar 11, 2014
Sold by
Shannon William J and Shannon Ellen A
Bought by
Mcconaghy Marilyn S and Shannon Ellen A
Purchase Details
Closed on
Oct 7, 2009
Sold by
Shannon William J and Shannon Ellen A
Bought by
Shannon William J and Shannon Ellen A
Create a Home Valuation Report for This Property
The Home Valuation Report is an in-depth analysis detailing your home's value as well as a comparison with similar homes in the area
Home Values in the Area
Average Home Value in this Area
Purchase History
| Date | Buyer | Sale Price | Title Company |
|---|---|---|---|
| Marilyn S Mcconaghy T S | -- | -- | |
| Marilyn S Mcconaghy T S | -- | -- | |
| Mcconaghy Marilyn S | -- | -- | |
| Mcconaghy Marilyn S | -- | -- | |
| Shannon William J | -- | -- | |
| Shannon William J | -- | -- | |
| Shannon William J | -- | -- |
Source: Public Records
Tax History Compared to Growth
Tax History
| Year | Tax Paid | Tax Assessment Tax Assessment Total Assessment is a certain percentage of the fair market value that is determined by local assessors to be the total taxable value of land and additions on the property. | Land | Improvement |
|---|---|---|---|---|
| 2025 | $2,485 | $573,900 | $281,400 | $292,500 |
| 2024 | $2,321 | $528,800 | $270,700 | $258,100 |
| 2023 | $2,245 | $480,800 | $246,000 | $234,800 |
| 2022 | $2,052 | $366,400 | $193,900 | $172,500 |
| 2021 | $1,998 | $331,400 | $190,100 | $141,300 |
| 2020 | $1,942 | $318,400 | $190,100 | $128,300 |
| 2019 | $1,966 | $318,700 | $202,400 | $116,300 |
| 2018 | $1,892 | $298,500 | $192,700 | $105,800 |
| 2017 | $1,722 | $280,000 | $177,500 | $102,500 |
| 2016 | $1,651 | $252,800 | $167,300 | $85,500 |
| 2015 | $1,618 | $252,800 | $167,300 | $85,500 |
| 2014 | $1,541 | $242,700 | $157,200 | $85,500 |
Source: Public Records
Map
Nearby Homes
- 102 Sea St
- 402 Old Wharf Rd
- 402 Old Wharf Rd
- 22 Ferncliff Rd
- 405 Old Wharf Rd Unit B204
- 405 Old Wharf Rd Unit B204
- 11 Ocean Park W
- 9 Chase Ave Unit 6
- 12 Cross St
- 26 Manning Rd
- 37-A Beach Hills Rd
- 37 Beach Hills Rd
- 159 Center St Unit 22
- 262 Old Wharf Rd Unit 67
- 262 Old Wharf Rd Unit 5
- 262 Old Wharf Rd Unit 5
- 262 Old Wharf Rd Unit 20
- 262 Old Wharf Rd Unit 87
- 31 Easy St
- 1 E Belmont Unit 630
- 82 Union Wharf Rd
- 48 West St
- 50 West St
- 41 Hamilton Rd
- 38 Highbank Cartway
- 122 Sea St
- 37 Hamilton Rd
- 44 West St
- 34 Highbank Cartway
- 33 Hamilton Rd
- 72 Union Wharf Rd
- 75 Union Wharf Rd Unit 3
- 75 Union Wharf Rd Unit 4
- 75 Union Wharf Rd Unit 2
- 75 Union Wharf Rd Unit 1
- 75 Union Wharf Rd Unit 2B
- 75 Union Wharf Rd Unit 2A
- 75 Union Wharf Rd Unit 1B
- 75 Union Wharf Rd Unit 1A
- 75 Union Wharf Rd