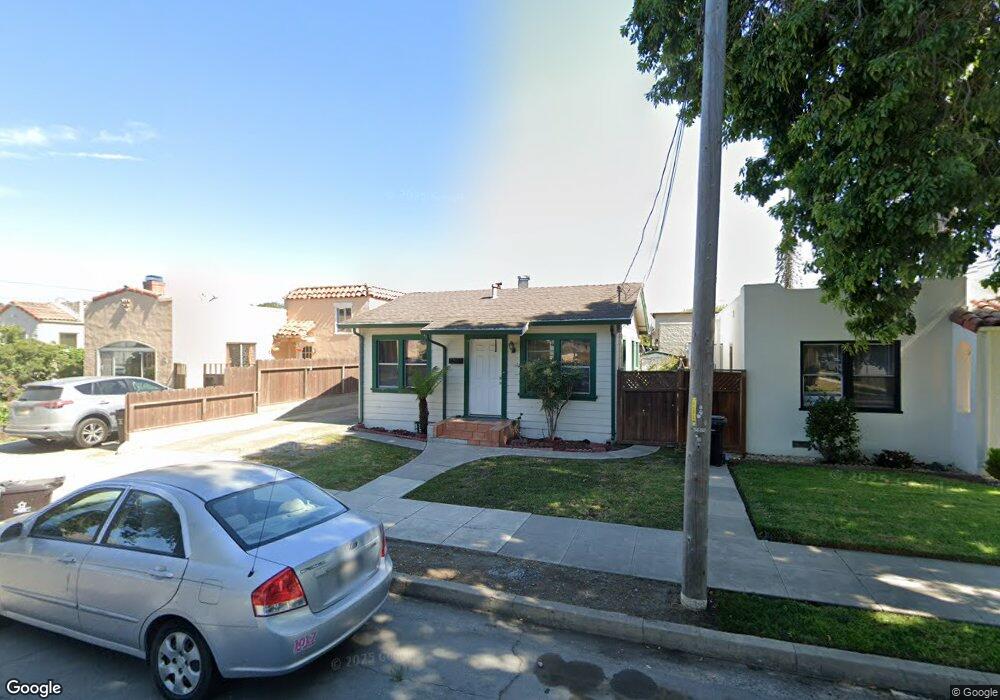
49 West St Salinas, CA 93901
South Salinas NeighborhoodEstimated Value: $353,651 - $498,000
1
Bed
1
Bath
576
Sq Ft
$762/Sq Ft
Est. Value
About This Home
This home is located at 49 West St, Salinas, CA 93901 and is currently estimated at $438,663, approximately $761 per square foot. 49 West St is a home located in Monterey County with nearby schools including Roosevelt Elementary School, Laurel Wood Elementary School, and Washington Middle School.
Ownership History
Date
Name
Owned For
Owner Type
Purchase Details
Closed on
Jul 20, 1998
Sold by
Morris Arthur and Morris Lillie Mae
Bought by
Segura Carmen
Current Estimated Value
Home Financials for this Owner
Home Financials are based on the most recent Mortgage that was taken out on this home.
Original Mortgage
$68,000
Outstanding Balance
$13,928
Interest Rate
7.01%
Estimated Equity
$424,735
Create a Home Valuation Report for This Property
The Home Valuation Report is an in-depth analysis detailing your home's value as well as a comparison with similar homes in the area
Home Values in the Area
Average Home Value in this Area
Purchase History
| Date | Buyer | Sale Price | Title Company |
|---|---|---|---|
| Segura Carmen | $85,000 | Old Republic Title Company |
Source: Public Records
Mortgage History
| Date | Status | Borrower | Loan Amount |
|---|---|---|---|
| Open | Segura Carmen | $68,000 |
Source: Public Records
Tax History
| Year | Tax Paid | Tax Assessment Tax Assessment Total Assessment is a certain percentage of the fair market value that is determined by local assessors to be the total taxable value of land and additions on the property. | Land | Improvement |
|---|---|---|---|---|
| 2025 | $1,571 | $133,231 | $78,374 | $54,857 |
| 2024 | $1,571 | $130,620 | $76,838 | $53,782 |
| 2023 | $1,519 | $128,060 | $75,332 | $52,728 |
| 2022 | $1,460 | $125,550 | $73,855 | $51,695 |
| 2021 | $1,403 | $123,089 | $72,407 | $50,682 |
| 2020 | $1,365 | $121,828 | $71,665 | $50,163 |
| 2019 | $1,353 | $119,440 | $70,260 | $49,180 |
| 2018 | $1,334 | $117,099 | $68,883 | $48,216 |
| 2017 | $1,335 | $114,804 | $67,533 | $47,271 |
| 2016 | $1,335 | $112,554 | $66,209 | $46,345 |
| 2015 | $1,346 | $110,864 | $65,215 | $45,649 |
| 2014 | $1,259 | $108,693 | $63,938 | $44,755 |
Source: Public Records
Map
Nearby Homes
- 19 West St
- 23 Capitol St
- 62 Buena Vista St
- 58 Young Dr
- 606 Central Ave
- 612 Central Ave
- 330 Homestead Ave
- 13 E Lake St
- 104 W Rossi St Unit 13
- 350 Victor St
- 230 Martella St
- 220 Pajaro St
- 89 Clark St
- 730 Lemos Ave
- 746 Nacional Ct
- 805 Iverson St
- 710 Campus Ave
- 767 Lemos Ave
- 840 Hastings Ave
- 234 Cherry Dr
Your Personal Tour Guide
Ask me questions while you tour the home.