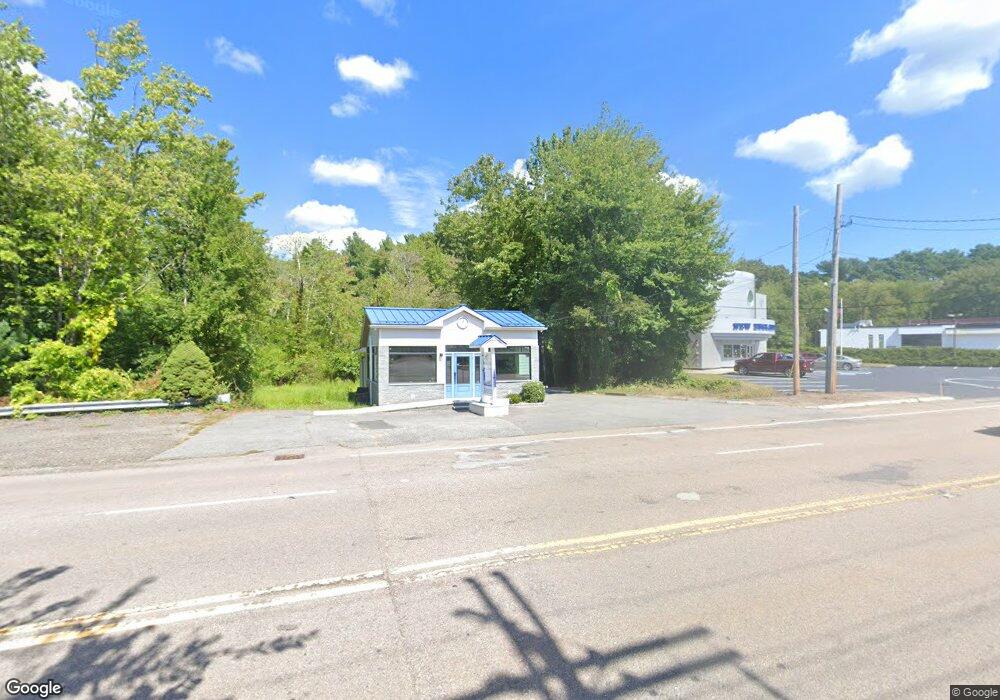
49 Whiting St Hingham, MA 02043
South Hingham NeighborhoodEstimated Value: $548,917
1
Bed
1
Bath
858
Sq Ft
$640/Sq Ft
Est. Value
About This Home
This home is located at 49 Whiting St, Hingham, MA 02043 and is currently estimated at $548,917, approximately $639 per square foot. 49 Whiting St is a home located in Plymouth County with nearby schools including South Elementary School, Hingham Middle School, and Hingham High School.
Ownership History
Date
Name
Owned For
Owner Type
Purchase Details
Closed on
Jan 10, 2018
Sold by
49 Whiting Street Rt and Crook
Bought by
Bf Realty Llc
Current Estimated Value
Home Financials for this Owner
Home Financials are based on the most recent Mortgage that was taken out on this home.
Original Mortgage
$60,000
Outstanding Balance
$50,343
Interest Rate
3.9%
Mortgage Type
New Conventional
Estimated Equity
$501,275
Purchase Details
Closed on
Aug 7, 2002
Sold by
Cmm Rt and Mccue
Bought by
49 Whiting St Rt and Crook
Purchase Details
Closed on
Apr 24, 1996
Sold by
Calaska Partners and Fortuna Investments
Bought by
Cmm Rt and Mccue
Purchase Details
Closed on
Mar 28, 1995
Sold by
Lutchman Selvon S and Lutchman Sylvia
Bought by
Calaska Partners
Purchase Details
Closed on
Feb 1, 1990
Sold by
Grenga John S
Bought by
Lutchman Selvon S
Purchase Details
Closed on
May 17, 1988
Sold by
Mazzio Frank J
Bought by
Grenga John S
Home Financials for this Owner
Home Financials are based on the most recent Mortgage that was taken out on this home.
Original Mortgage
$192,000
Interest Rate
10.02%
Mortgage Type
Commercial
Purchase Details
Closed on
May 1, 1987
Sold by
Jewellette Rt
Bought by
Mazzio Frank J
Create a Home Valuation Report for This Property
The Home Valuation Report is an in-depth analysis detailing your home's value as well as a comparison with similar homes in the area
Home Values in the Area
Average Home Value in this Area
Purchase History
| Date | Buyer | Sale Price | Title Company |
|---|---|---|---|
| Bf Realty Llc | $315,000 | -- | |
| 49 Whiting St Rt | $92,500 | -- | |
| 49 Whiting St Rt | $92,500 | -- | |
| Cmm Rt | $55,000 | -- | |
| Cmm Rt | $55,000 | -- | |
| Calaska Partners | $55,000 | -- | |
| Calaska Partners | $55,000 | -- | |
| Lutchman Selvon S | $174,000 | -- | |
| Grenga John S | $225,000 | -- | |
| Mazzio Frank J | $175,000 | -- |
Source: Public Records
Mortgage History
| Date | Status | Borrower | Loan Amount |
|---|---|---|---|
| Open | Bf Realty Llc | $60,000 | |
| Closed | Mazzio Frank J | $60,000 | |
| Previous Owner | Mazzio Frank J | $192,000 |
Source: Public Records
Tax History
| Year | Tax Paid | Tax Assessment Tax Assessment Total Assessment is a certain percentage of the fair market value that is determined by local assessors to be the total taxable value of land and additions on the property. | Land | Improvement |
|---|---|---|---|---|
| 2025 | $2,906 | $271,800 | $147,300 | $124,500 |
| 2024 | $3,002 | $276,700 | $147,300 | $129,400 |
| 2023 | $2,767 | $276,700 | $147,300 | $129,400 |
| 2022 | $2,542 | $219,900 | $133,600 | $86,300 |
| 2021 | $2,466 | $209,000 | $126,000 | $83,000 |
| 2020 | $2,343 | $203,200 | $126,000 | $77,200 |
| 2019 | $2,306 | $195,300 | $126,000 | $69,300 |
| 2018 | $2,299 | $195,300 | $126,000 | $69,300 |
| 2017 | $2,291 | $187,000 | $123,000 | $64,000 |
| 2016 | $2,228 | $178,400 | $117,100 | $61,300 |
| 2015 | $2,235 | $178,400 | $117,100 | $61,300 |
Source: Public Records
Map
Nearby Homes
- 100 Whiting St
- 12 Country Dr
- 17 Pine Haven Cir
- 183 Gardner St
- 4 Kerri Ln
- 1 Kerri Ln
- 18 Whiting Ln
- 18 Colby St
- 55 Turner Rd
- 5 Blueberry Ct
- 8 Blueberry Ct
- 214 Washington St Unit 24
- 214 Washington St Unit 28
- 22 Longmeadow Rd
- 5 Old County Rd
- 738 Whiting St
- 18 Winterberry Ln
- 9 Mast Hill Rd
- 49 Washington Park Dr
- 251 Prospect St
- 54 Whiting St
- 37 Whiting St
- 65 Whiting St
- 4 Accord Ln
- 1 Accord Ln
- 6 Accord Ln
- 2 Accord Ln
- 38 Whiting St
- 3 Accord Ln
- 66 Whiting St
- 28 Whiting St
- 27 Whiting St
- 8 Accord Ln
- 7 Accord Ln
- 69 Whiting St
- 1193 Main St Unit 2A
- 1193 Main St Unit D2
- 1193 Main St Unit D1
- 1193 Main St Unit C2
- 1193 Main St Unit B2
Your Personal Tour Guide
Ask me questions while you tour the home.