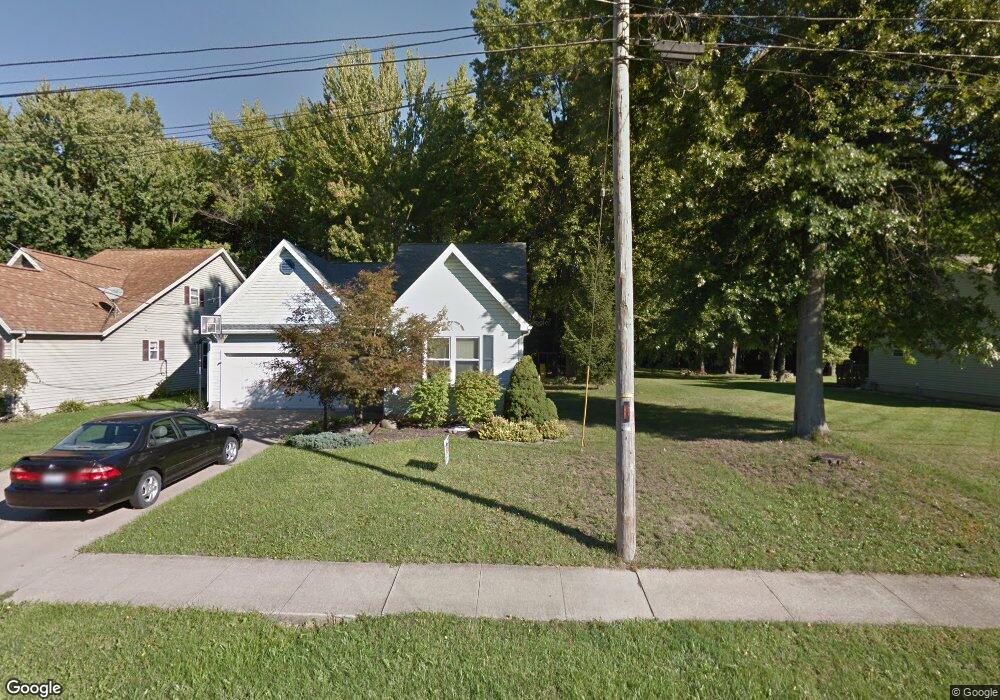
49 Williams Ave Norwalk, OH 44857
Estimated Value: $200,000 - $226,000
2
Beds
3
Baths
1,588
Sq Ft
$135/Sq Ft
Est. Value
About This Home
This home is located at 49 Williams Ave, Norwalk, OH 44857 and is currently estimated at $213,982, approximately $134 per square foot. 49 Williams Ave is a home located in Huron County with nearby schools including Maplehurst Elementary School, League Elementary School, and Pleasant Elementary School.
Ownership History
Date
Name
Owned For
Owner Type
Purchase Details
Closed on
Mar 30, 2020
Sold by
Koenig Lisa M and Mccallum Lisa M
Bought by
Koenig Stephen J
Current Estimated Value
Purchase Details
Closed on
May 7, 2003
Bought by
Koenig Stephen J and Mccallum Lisa M
Purchase Details
Closed on
Oct 3, 1997
Sold by
Billman Brian J
Bought by
Hallock Timothy P and Hallock Michelle
Home Financials for this Owner
Home Financials are based on the most recent Mortgage that was taken out on this home.
Original Mortgage
$90,000
Outstanding Balance
$12,393
Interest Rate
7.54%
Mortgage Type
New Conventional
Estimated Equity
$201,589
Purchase Details
Closed on
May 1, 1995
Sold by
Parks Charles K
Bought by
Billman Brian J and Stablein Patricia
Home Financials for this Owner
Home Financials are based on the most recent Mortgage that was taken out on this home.
Original Mortgage
$91,000
Interest Rate
7.25%
Mortgage Type
New Conventional
Create a Home Valuation Report for This Property
The Home Valuation Report is an in-depth analysis detailing your home's value as well as a comparison with similar homes in the area
Home Values in the Area
Average Home Value in this Area
Purchase History
| Date | Buyer | Sale Price | Title Company |
|---|---|---|---|
| Koenig Stephen J | -- | None Available | |
| Koenig Stephen J | $130,000 | -- | |
| Hallock Timothy P | $116,000 | -- | |
| Billman Brian J | $98,000 | -- | |
| Billman Brian J | $98,000 | -- |
Source: Public Records
Mortgage History
| Date | Status | Borrower | Loan Amount |
|---|---|---|---|
| Open | Hallock Timothy P | $90,000 | |
| Previous Owner | Billman Brian J | $91,000 |
Source: Public Records
Tax History
| Year | Tax Paid | Tax Assessment Tax Assessment Total Assessment is a certain percentage of the fair market value that is determined by local assessors to be the total taxable value of land and additions on the property. | Land | Improvement |
|---|---|---|---|---|
| 2024 | $2,620 | $63,980 | $9,510 | $54,470 |
| 2023 | $2,611 | $48,380 | $6,470 | $41,910 |
| 2022 | $1,950 | $48,380 | $6,470 | $41,910 |
| 2021 | $1,951 | $48,380 | $6,470 | $41,910 |
| 2020 | $1,895 | $44,710 | $6,470 | $38,240 |
| 2019 | $1,854 | $44,710 | $6,470 | $38,240 |
| 2018 | $1,905 | $46,770 | $4,700 | $42,070 |
| 2017 | $1,801 | $44,060 | $4,700 | $39,360 |
| 2016 | $1,767 | $44,060 | $4,700 | $39,360 |
| 2015 | $1,766 | $44,070 | $4,710 | $39,360 |
| 2014 | $1,637 | $40,500 | $3,780 | $36,720 |
| 2013 | $1,423 | $40,500 | $3,780 | $36,720 |
Source: Public Records
Map
Nearby Homes
- 73 Parsons St
- 43 Gallup Ave
- 110 Parsons St
- 116 Milan Ave
- 0 Milan Ave
- 408 Milan Ave
- 184 Tucker Ave
- 41 W Willard Ave
- 6 White Tail Way Unit C
- 33 E League St
- 33 Falcon Crest Dr Unit C
- 30 White Tail Way Unit A
- 25 E League St
- 3 Fox Run Cove
- 3 Fox Run Cove Unit B
- 123 E Main St
- 11 Deer Track Trail Unit A
- 167 Whittlesey Ave
- 28 Amber Way
- 34 Old State Rd N
- 47 Williams Ave
- 47 Williams St
- 45 Williams Ave
- 45 Williams St
- 51 Williams Ave
- 43 Williams Ave
- 43 Williams St
- 53 Williams Ave
- 0 Willard Ave Lot 2556
- 52 Williams Ave
- 50 Williams Ave
- 48 Williams Ave
- 55 Williams Ave
- 41 Williams Ave
- 41 Williams St
- 56 Williams Ave
- 46 Williams Ave
- 57 Williams Ave
- 44 Williams Ave
- 58 Williams Ave
Your Personal Tour Guide
Ask me questions while you tour the home.