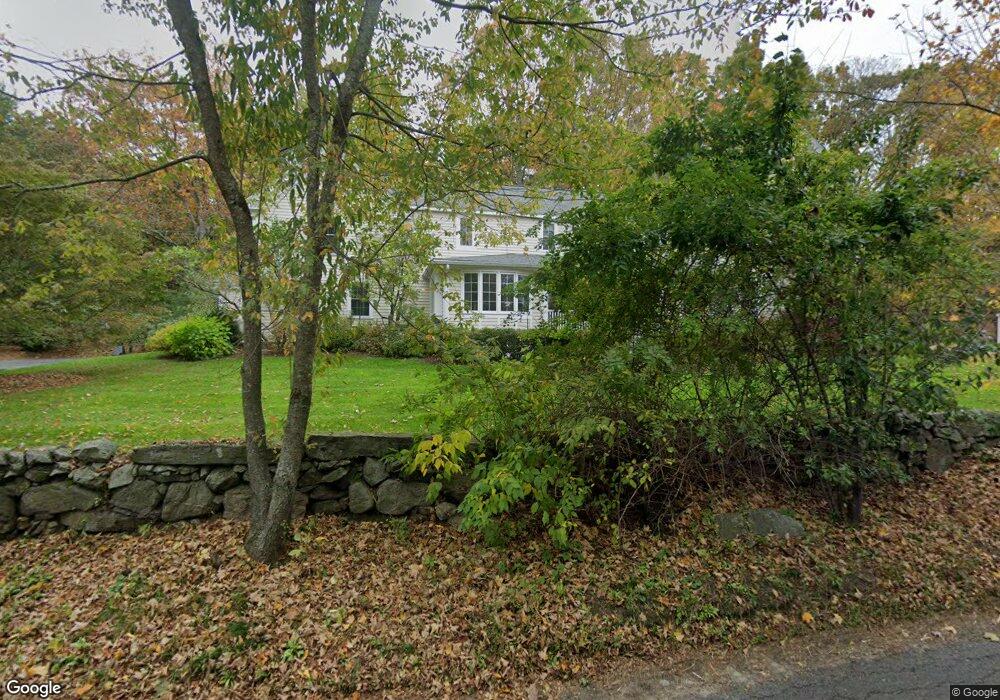
49 Willis Rd Sudbury, MA 01776
Estimated Value: $1,372,000 - $1,434,098
4
Beds
4
Baths
3,125
Sq Ft
$451/Sq Ft
Est. Value
About This Home
This home is located at 49 Willis Rd, Sudbury, MA 01776 and is currently estimated at $1,408,025, approximately $450 per square foot. 49 Willis Rd is a home located in Middlesex County with nearby schools including General John Nixon Elementary School, Ephraim Curtis Middle School, and Lincoln-Sudbury Regional High School.
Ownership History
Date
Name
Owned For
Owner Type
Purchase Details
Closed on
Sep 1, 2009
Sold by
Zetterquist Eric J and Zetterquist Alison H
Bought by
Bonk William F
Current Estimated Value
Purchase Details
Closed on
Sep 29, 1998
Sold by
Elfman Eric M and Elfman Barbara C
Bought by
Zetterquist Eric J and Zetterquist Alison H
Create a Home Valuation Report for This Property
The Home Valuation Report is an in-depth analysis detailing your home's value as well as a comparison with similar homes in the area
Home Values in the Area
Average Home Value in this Area
Purchase History
| Date | Buyer | Sale Price | Title Company |
|---|---|---|---|
| Bonk William F | $825,000 | -- | |
| Bonk William F | $825,000 | -- | |
| Zetterquist Eric J | $525,000 | -- |
Source: Public Records
Mortgage History
| Date | Status | Borrower | Loan Amount |
|---|---|---|---|
| Open | Zetterquist Eric J | $519,000 |
Source: Public Records
Tax History Compared to Growth
Tax History
| Year | Tax Paid | Tax Assessment Tax Assessment Total Assessment is a certain percentage of the fair market value that is determined by local assessors to be the total taxable value of land and additions on the property. | Land | Improvement |
|---|---|---|---|---|
| 2025 | $20,331 | $1,388,700 | $461,300 | $927,400 |
| 2024 | $19,582 | $1,340,300 | $447,700 | $892,600 |
| 2023 | $17,451 | $1,106,600 | $414,500 | $692,100 |
| 2022 | $16,018 | $887,400 | $380,100 | $507,300 |
| 2021 | $5,913 | $931,400 | $380,100 | $551,300 |
| 2020 | $5,597 | $931,400 | $380,100 | $551,300 |
| 2019 | $16,681 | $931,400 | $380,100 | $551,300 |
| 2018 | $5,024 | $904,200 | $400,100 | $504,100 |
| 2017 | $4,829 | $866,400 | $395,300 | $471,100 |
| 2016 | $14,836 | $833,500 | $380,100 | $453,400 |
| 2015 | $14,247 | $809,500 | $365,300 | $444,200 |
| 2014 | $14,236 | $789,600 | $354,500 | $435,100 |
Source: Public Records
Map
Nearby Homes
- 63 Canterbury Dr
- 55 Widow Rites Ln
- 45 Widow Rites Ln
- 24 Goodnow Rd
- 36 Old Forge Ln
- 12 Camperdown Ln
- 54 Phillips Rd
- 4 Elderberry Cir
- 47 Fairbank Rd
- 427 Concord Rd
- 5 Taintor Dr
- 166 Parker St Unit 4
- 14 Frost Ln
- 270 Old Lancaster Rd
- 11 Great Lake Dr
- 14 Tanbark Rd
- 57 Longfellow Rd
- 21 Summer St
- 7 Saddle Ridge Rd
- 42 Dakin Rd