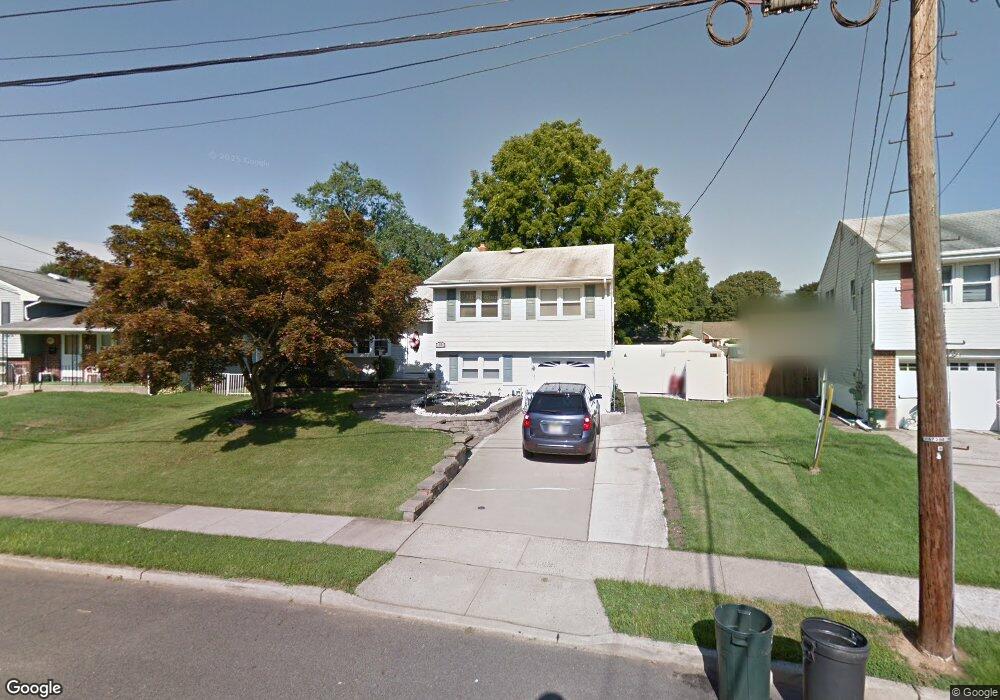
49 Winding Way Trenton, NJ 08620
Estimated Value: $439,000 - $464,000
--
Bed
--
Bath
1,360
Sq Ft
$333/Sq Ft
Est. Value
About This Home
This home is located at 49 Winding Way, Trenton, NJ 08620 and is currently estimated at $453,085, approximately $333 per square foot. 49 Winding Way is a home located in Mercer County with nearby schools including Yardville Heights Elementary School, Albert E. Grice Middle School, and Hamilton West-Watson High School.
Ownership History
Date
Name
Owned For
Owner Type
Purchase Details
Closed on
Aug 21, 2001
Sold by
Kitner Edward
Bought by
Maher Michael and Maher Phyllis
Current Estimated Value
Home Financials for this Owner
Home Financials are based on the most recent Mortgage that was taken out on this home.
Original Mortgage
$167,674
Outstanding Balance
$64,241
Interest Rate
7.06%
Mortgage Type
FHA
Estimated Equity
$388,844
Purchase Details
Closed on
Oct 18, 1995
Sold by
Keeling John R
Bought by
Kitner Edward and Kitner Bonnie
Home Financials for this Owner
Home Financials are based on the most recent Mortgage that was taken out on this home.
Original Mortgage
$124,000
Interest Rate
7.6%
Mortgage Type
FHA
Create a Home Valuation Report for This Property
The Home Valuation Report is an in-depth analysis detailing your home's value as well as a comparison with similar homes in the area
Home Values in the Area
Average Home Value in this Area
Purchase History
| Date | Buyer | Sale Price | Title Company |
|---|---|---|---|
| Maher Michael | $169,000 | -- | |
| Kitner Edward | $124,500 | -- |
Source: Public Records
Mortgage History
| Date | Status | Borrower | Loan Amount |
|---|---|---|---|
| Open | Maher Michael | $167,674 | |
| Previous Owner | Kitner Edward | $124,000 |
Source: Public Records
Tax History Compared to Growth
Tax History
| Year | Tax Paid | Tax Assessment Tax Assessment Total Assessment is a certain percentage of the fair market value that is determined by local assessors to be the total taxable value of land and additions on the property. | Land | Improvement |
|---|---|---|---|---|
| 2025 | $7,813 | $221,700 | $78,500 | $143,200 |
| 2024 | $7,323 | $221,700 | $78,500 | $143,200 |
| 2023 | $7,323 | $221,700 | $78,500 | $143,200 |
| 2022 | $7,207 | $221,700 | $78,500 | $143,200 |
| 2021 | $7,744 | $221,700 | $78,500 | $143,200 |
| 2020 | $6,946 | $221,700 | $78,500 | $143,200 |
| 2019 | $6,795 | $221,700 | $78,500 | $143,200 |
| 2018 | $6,735 | $221,700 | $78,500 | $143,200 |
| 2017 | $6,567 | $221,700 | $78,500 | $143,200 |
| 2016 | $5,995 | $221,700 | $78,500 | $143,200 |
| 2015 | $6,569 | $141,600 | $53,300 | $88,300 |
| 2014 | $6,458 | $141,600 | $53,300 | $88,300 |
Source: Public Records
Map
Nearby Homes