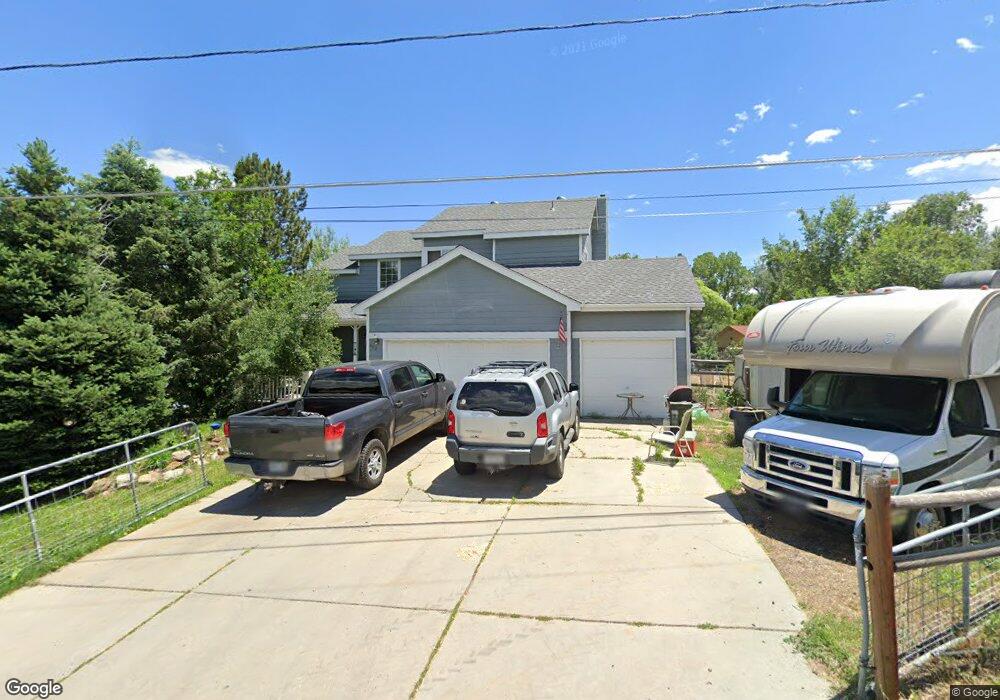
490 Allison St Lakewood, CO 80226
Creighton NeighborhoodEstimated Value: $825,277 - $918,000
3
Beds
5
Baths
1,757
Sq Ft
$499/Sq Ft
Est. Value
About This Home
This home is located at 490 Allison St, Lakewood, CO 80226 and is currently estimated at $876,569, approximately $498 per square foot. 490 Allison St is a home located in Jefferson County with nearby schools including South Lakewood Elementary School, Creighton Middle School, and Lakewood High School.
Ownership History
Date
Name
Owned For
Owner Type
Purchase Details
Closed on
May 30, 2003
Sold by
Schimming Susan
Bought by
Coffman Jill and Klem Sheri M
Current Estimated Value
Home Financials for this Owner
Home Financials are based on the most recent Mortgage that was taken out on this home.
Original Mortgage
$322,700
Outstanding Balance
$121,684
Interest Rate
3.87%
Mortgage Type
Purchase Money Mortgage
Estimated Equity
$754,885
Purchase Details
Closed on
Feb 22, 2001
Sold by
Schimming Mark Curtis Schimming Susan S and Schimming Susan
Bought by
Schimming Susan
Home Financials for this Owner
Home Financials are based on the most recent Mortgage that was taken out on this home.
Original Mortgage
$104,000
Interest Rate
6.97%
Purchase Details
Closed on
Nov 9, 1993
Sold by
Schimming Marc Curtis and Schimming Susan
Bought by
Schimming Mark Curtis and Schimming Susan
Home Financials for this Owner
Home Financials are based on the most recent Mortgage that was taken out on this home.
Original Mortgage
$98,000
Interest Rate
6.86%
Create a Home Valuation Report for This Property
The Home Valuation Report is an in-depth analysis detailing your home's value as well as a comparison with similar homes in the area
Home Values in the Area
Average Home Value in this Area
Purchase History
| Date | Buyer | Sale Price | Title Company |
|---|---|---|---|
| Coffman Jill | $350,000 | Land Title | |
| Schimming Susan | -- | Land Title | |
| Schimming Mark Curtis | -- | -- |
Source: Public Records
Mortgage History
| Date | Status | Borrower | Loan Amount |
|---|---|---|---|
| Open | Coffman Jill | $322,700 | |
| Previous Owner | Schimming Susan | $104,000 | |
| Previous Owner | Schimming Mark Curtis | $98,000 |
Source: Public Records
Tax History Compared to Growth
Tax History
| Year | Tax Paid | Tax Assessment Tax Assessment Total Assessment is a certain percentage of the fair market value that is determined by local assessors to be the total taxable value of land and additions on the property. | Land | Improvement |
|---|---|---|---|---|
| 2024 | $5,408 | $59,966 | $30,424 | $29,542 |
| 2023 | $5,408 | $59,966 | $30,424 | $29,542 |
| 2022 | $3,944 | $42,748 | $20,071 | $22,677 |
| 2021 | $4,000 | $43,978 | $20,648 | $23,330 |
| 2020 | $3,638 | $40,180 | $18,716 | $21,464 |
| 2019 | $3,591 | $40,180 | $18,716 | $21,464 |
| 2018 | $3,059 | $33,097 | $12,078 | $21,019 |
| 2017 | $2,688 | $33,097 | $12,078 | $21,019 |
| 2016 | $3,218 | $36,959 | $14,767 | $22,192 |
| 2015 | $3,026 | $36,959 | $14,767 | $22,192 |
| 2014 | $3,026 | $31,842 | $14,282 | $17,560 |
Source: Public Records
Map
Nearby Homes
- 653 Brentwood St
- 444 Vance St Unit E6
- 765 Emerald Ln
- 562 Vance St Unit D9
- 7785 Westview Dr
- 548 Vance St Unit B10
- 7223 W 1st Place
- 630 Estes St
- 8060 W 9th Ave Unit 107
- 135 Dover St
- 65 Cody St
- 25 S Wadsworth Blvd
- 730 Crescent Ln
- 105 Dudley St
- 35 S Cody St
- 8516 W 10th Ave
- 10 Teller St
- 8542 W 10th Ave
- 7493 W Cedar Cir
- 940 & 950 Upham St