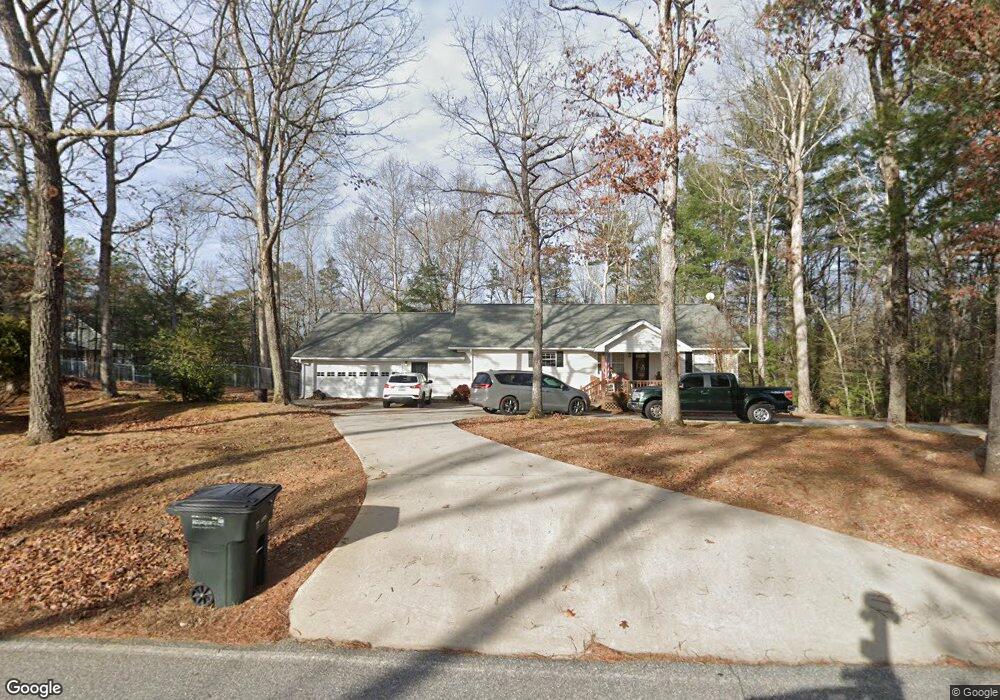
490 Chapman Ford Rd Blairsville, GA 30512
Ivylog NeighborhoodEstimated Value: $323,000 - $441,000
3
Beds
2
Baths
1,400
Sq Ft
$278/Sq Ft
Est. Value
About This Home
This home is located at 490 Chapman Ford Rd, Blairsville, GA 30512 and is currently estimated at $389,018, approximately $277 per square foot. 490 Chapman Ford Rd is a home located in Union County with nearby schools including Union County Primary School, Union County Elementary School, and Union County Middle School.
Ownership History
Date
Name
Owned For
Owner Type
Purchase Details
Closed on
May 23, 2005
Sold by
Combs Jimmy
Bought by
Bowen John and Bowen Barbara
Current Estimated Value
Home Financials for this Owner
Home Financials are based on the most recent Mortgage that was taken out on this home.
Original Mortgage
$52,000
Interest Rate
5.74%
Mortgage Type
New Conventional
Purchase Details
Closed on
Jun 7, 2001
Sold by
Kindig La Mona
Bought by
Combs Jimmy and Combs Mindy
Purchase Details
Closed on
Oct 8, 1998
Sold by
Combs Jimmy
Bought by
Kindig La Mona
Purchase Details
Closed on
Jul 9, 1998
Sold by
Lance Jack
Bought by
Combs Jimmy
Purchase Details
Closed on
Feb 3, 1998
Sold by
Martin Gary
Bought by
Lance Jack
Purchase Details
Closed on
Jul 22, 1997
Sold by
Mountain Ventures In
Bought by
Martin Gary
Create a Home Valuation Report for This Property
The Home Valuation Report is an in-depth analysis detailing your home's value as well as a comparison with similar homes in the area
Home Values in the Area
Average Home Value in this Area
Purchase History
| Date | Buyer | Sale Price | Title Company |
|---|---|---|---|
| Bowen John | $192,000 | -- | |
| Combs Jimmy | $145,000 | -- | |
| Kindig La Mona | $20,000 | -- | |
| Combs Jimmy | $15,000 | -- | |
| Lance Jack | -- | -- | |
| Martin Gary | $47,500 | -- |
Source: Public Records
Mortgage History
| Date | Status | Borrower | Loan Amount |
|---|---|---|---|
| Closed | Bowen John | $52,000 | |
| Open | Bowen John | $120,800 |
Source: Public Records
Tax History Compared to Growth
Tax History
| Year | Tax Paid | Tax Assessment Tax Assessment Total Assessment is a certain percentage of the fair market value that is determined by local assessors to be the total taxable value of land and additions on the property. | Land | Improvement |
|---|---|---|---|---|
| 2024 | $1,489 | $128,080 | $18,600 | $109,480 |
| 2023 | $1,670 | $127,440 | $18,600 | $108,840 |
| 2022 | $1,339 | $102,600 | $18,600 | $84,000 |
| 2021 | $1,208 | $78,680 | $11,120 | $67,560 |
| 2020 | $1,296 | $70,512 | $11,900 | $58,612 |
| 2019 | $1,225 | $70,512 | $11,900 | $58,612 |
| 2018 | $1,239 | $70,512 | $11,900 | $58,612 |
| 2017 | $1,203 | $70,512 | $11,900 | $58,612 |
| 2016 | $1,204 | $70,512 | $11,900 | $58,612 |
| 2015 | $1,214 | $70,512 | $11,900 | $58,612 |
| 2013 | -- | $70,511 | $11,900 | $58,611 |
Source: Public Records
Map
Nearby Homes
- 176 Madison Ave Unit 8
- 176 Madison Ave
- 1281 Deaver Rd
- 89 Whisper Cove
- 184 Whisper Cove
- 10442 Georgia 325
- 39 Dalewood Dr
- 236 Watts Place S
- Lot 48 Sanctuary Dr
- LT 38 Sanctuary Dr
- LOT 87 the Sanctuary
- Lot 89 Creek Hollow Ln
- Lot 45 Sweetwater Ln
- 2 Acres Bennington Dr
- 99 Bennington Dr
- 314 Moccasin Ln
- 71 Conley Creek Cir
- 302 Brook Green Ct
- 163 Moccasin Ln
- 129 Moccasin Ln
- 47 Dale Dr
- 452 Chapman Ford Rd
- 4740 Dale Dr
- 46 Dale Dr
- 481 Chapman Ford Rd
- 28 Lori Ln
- 15 Dale Dr
- 15 Dale Dr Unit 41 & 42
- 26 Dale Dr Unit 37
- 26 Dale Dr
- 44 Lori Ln
- 239 Deaver Cove Rd
- 4672 Lori Ln
- 6106 Chapman Ford Rd
- 419 Chapman Ford Rd
- 39 Gray Rd
- 80 Deaver Cove Rd
- 80 Deaver Cove Rd
- 152 Deaver Cove Rd
- 394 Chapman Ford Rd