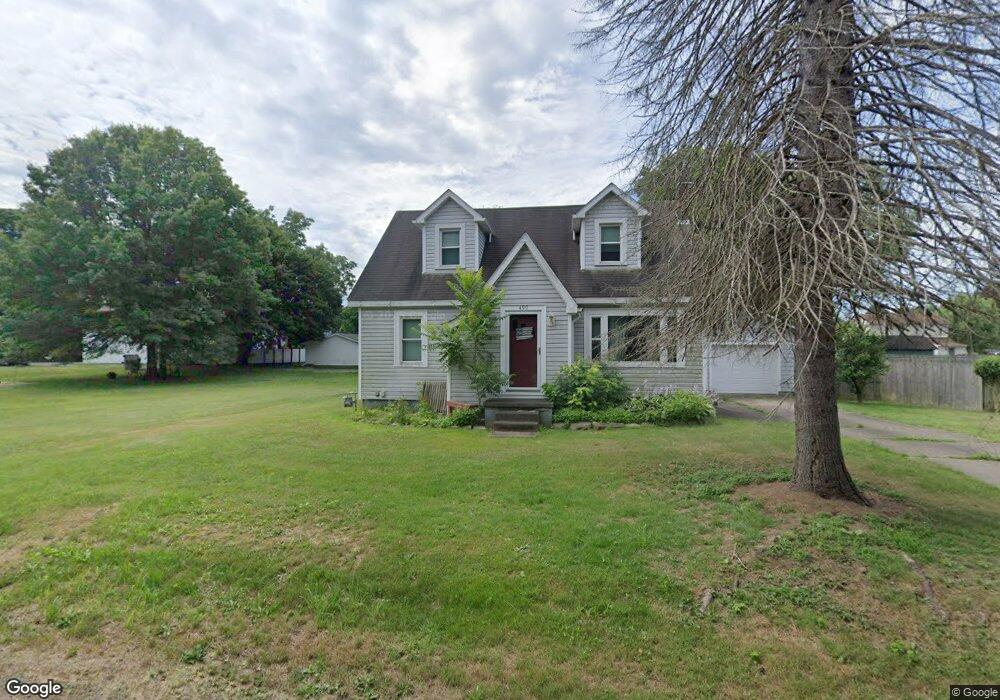
490 Cherry Fork Ave Leetonia, OH 44431
Estimated Value: $82,000 - $206,000
1
Bed
1
Bath
1,404
Sq Ft
$98/Sq Ft
Est. Value
About This Home
This home is located at 490 Cherry Fork Ave, Leetonia, OH 44431 and is currently estimated at $137,236, approximately $97 per square foot. 490 Cherry Fork Ave is a home located in Columbiana County with nearby schools including Leetonia Elementary K-6, Leetonia Elementary School, and Leetonia Jr./Sr. High School.
Ownership History
Date
Name
Owned For
Owner Type
Purchase Details
Closed on
Aug 10, 2005
Sold by
Hoover Ruth Elaine and Hoover Vincent C
Bought by
Toot Stacie Jill
Current Estimated Value
Home Financials for this Owner
Home Financials are based on the most recent Mortgage that was taken out on this home.
Original Mortgage
$65,500
Outstanding Balance
$33,317
Interest Rate
5.66%
Mortgage Type
Purchase Money Mortgage
Estimated Equity
$103,919
Purchase Details
Closed on
Mar 28, 2005
Sold by
Evans David and Evans Stephanie
Bought by
Hoover Ruth Elaine
Purchase Details
Closed on
Feb 4, 1998
Sold by
Neiheisel Harry N and Neiheisel Mary Alma
Bought by
Evans David and Evans Stephanie A
Home Financials for this Owner
Home Financials are based on the most recent Mortgage that was taken out on this home.
Original Mortgage
$49,400
Interest Rate
6.99%
Purchase Details
Closed on
Jul 29, 1993
Bought by
Neiheisel Harry H and Neiheisel Or
Create a Home Valuation Report for This Property
The Home Valuation Report is an in-depth analysis detailing your home's value as well as a comparison with similar homes in the area
Purchase History
| Date | Buyer | Sale Price | Title Company |
|---|---|---|---|
| Toot Stacie Jill | $65,500 | None Available | |
| Hoover Ruth Elaine | $39,100 | None Available | |
| Evans David | $52,000 | Neo Title | |
| Neiheisel Harry H | -- | -- |
Source: Public Records
Mortgage History
| Date | Status | Borrower | Loan Amount |
|---|---|---|---|
| Open | Toot Stacie Jill | $65,500 | |
| Previous Owner | Evans David | $49,400 |
Source: Public Records
Tax History
| Year | Tax Paid | Tax Assessment Tax Assessment Total Assessment is a certain percentage of the fair market value that is determined by local assessors to be the total taxable value of land and additions on the property. | Land | Improvement |
|---|---|---|---|---|
| 2025 | $1,248 | $35,640 | $5,640 | $30,000 |
| 2024 | $1,083 | $29,680 | $4,690 | $24,990 |
| 2023 | $1,085 | $29,680 | $4,690 | $24,990 |
| 2022 | $1,089 | $29,680 | $4,690 | $24,990 |
| 2021 | $899 | $23,350 | $4,660 | $18,690 |
| 2020 | $920 | $23,350 | $4,660 | $18,690 |
| 2019 | $929 | $23,350 | $4,660 | $18,690 |
| 2018 | $912 | $21,220 | $4,240 | $16,980 |
| 2017 | $923 | $21,220 | $4,240 | $16,980 |
| 2016 | $923 | $21,040 | $5,710 | $15,330 |
| 2015 | $895 | $21,040 | $5,710 | $15,330 |
| 2014 | $884 | $21,040 | $5,710 | $15,330 |
Source: Public Records
Map
Nearby Homes
- 309 Ridge St
- 35 Center St
- 14 W Main St
- 405 Orchard Dr
- 38875 Old State Route 344
- 38495 Old State Route 344
- 200 E Main St
- 240 W Main St
- 275 Walnut St
- 1229 Columbiana Lisbon Rd Unit 28
- 1229 Columbiana-Lisbon Rd Unit 41
- 39144 State Route 558
- 42082 Duquesne St W
- 120 Walter Ave
- 3190 Bunker Hill Rd
- 909 Lisbon Rd
- 5570 W Garfield Rd
- 223 S Main St
- 807 Fairfield School Rd
- 888 Fairfield School Rd
- 506 Cherry Fork Ave
- 506 Cherry Fork Ave
- 506 Cherry Fork Ave
- 495 Columbia St
- 480 Cherry Fork Ave
- 489 Columbia St
- 503 Columbia St
- 487 Columbia St
- 481 Columbia St
- 511 Columbia St
- 467 Cherry Fork Ave
- 509 Cherry Fork Ave
- 473 Columbia St
- 602 Cherry Fork Ave
- 601 Cherry Fork Ave
- 465 Columbia St
- 456 Cherry Fork Ave
- 601 Columbia St
- 490 Columbia St
- 502 Columbia St
Your Personal Tour Guide
Ask me questions while you tour the home.