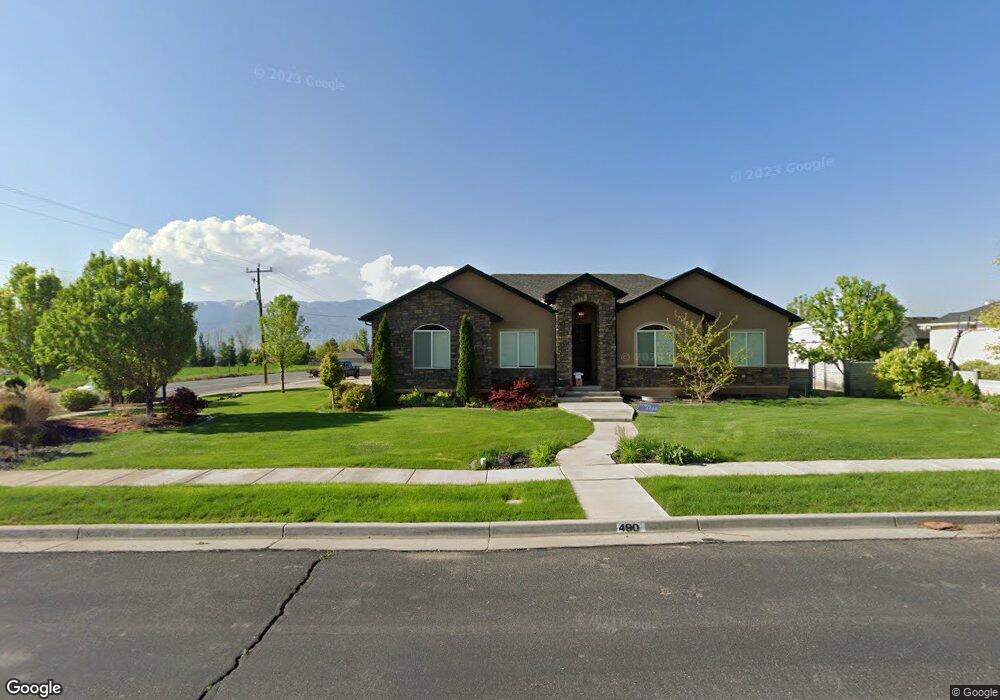
490 E 950 N Richfield, UT 84701
Estimated Value: $581,000 - $720,000
Studio
1
Bath
2,064
Sq Ft
$314/Sq Ft
Est. Value
About This Home
This home is located at 490 E 950 N, Richfield, UT 84701 and is currently estimated at $647,195, approximately $313 per square foot. 490 E 950 N is a home located in Sevier County with nearby schools including Pahvant School, Ashman School, and Red Hills Middle School.
Ownership History
Date
Name
Owned For
Owner Type
Purchase Details
Closed on
Oct 26, 2021
Sold by
Reitz Jason
Bought by
Reitz Jason and Reitz Deann
Current Estimated Value
Home Financials for this Owner
Home Financials are based on the most recent Mortgage that was taken out on this home.
Original Mortgage
$220,000
Outstanding Balance
$166,795
Interest Rate
2.1%
Mortgage Type
New Conventional
Estimated Equity
$480,400
Purchase Details
Closed on
Mar 31, 2006
Sold by
Klm Family Partnership
Bought by
Reitz Jason L and Reitz Deann
Create a Home Valuation Report for This Property
The Home Valuation Report is an in-depth analysis detailing your home's value as well as a comparison with similar homes in the area
Purchase History
| Date | Buyer | Sale Price | Title Company |
|---|---|---|---|
| Reitz Jason | -- | Security Escrow & Ttl Ins A | |
| Reitz Jason | -- | Security Escrow & Ttl Ins A | |
| Reitz Jason L | -- | Utah Title & Abstract Co |
Source: Public Records
Mortgage History
| Date | Status | Borrower | Loan Amount |
|---|---|---|---|
| Open | Reitz Jason | $220,000 |
Source: Public Records
Tax History
| Year | Tax Paid | Tax Assessment Tax Assessment Total Assessment is a certain percentage of the fair market value that is determined by local assessors to be the total taxable value of land and additions on the property. | Land | Improvement |
|---|---|---|---|---|
| 2025 | $3,021 | $311,158 | $47,163 | $263,995 |
| 2024 | $3,021 | $300,395 | $39,870 | $260,525 |
| 2023 | $2,972 | $319,669 | $38,337 | $281,332 |
| 2022 | $2,876 | $262,643 | $39,785 | $222,858 |
| 2021 | $2,747 | $206,372 | $33,601 | $172,771 |
| 2020 | $2,488 | $185,904 | $38,280 | $147,624 |
| 2019 | $2,207 | $174,590 | $31,900 | $142,690 |
| 2018 | $2,464 | $174,590 | $31,900 | $142,690 |
| 2017 | $2,435 | $164,720 | $31,900 | $132,820 |
| 2016 | $1,764 | $164,720 | $0 | $0 |
| 2015 | $1,764 | $160,670 | $0 | $0 |
| 2014 | $1,764 | $153,260 | $0 | $0 |
Source: Public Records
Map
Nearby Homes
Your Personal Tour Guide
Ask me questions while you tour the home.