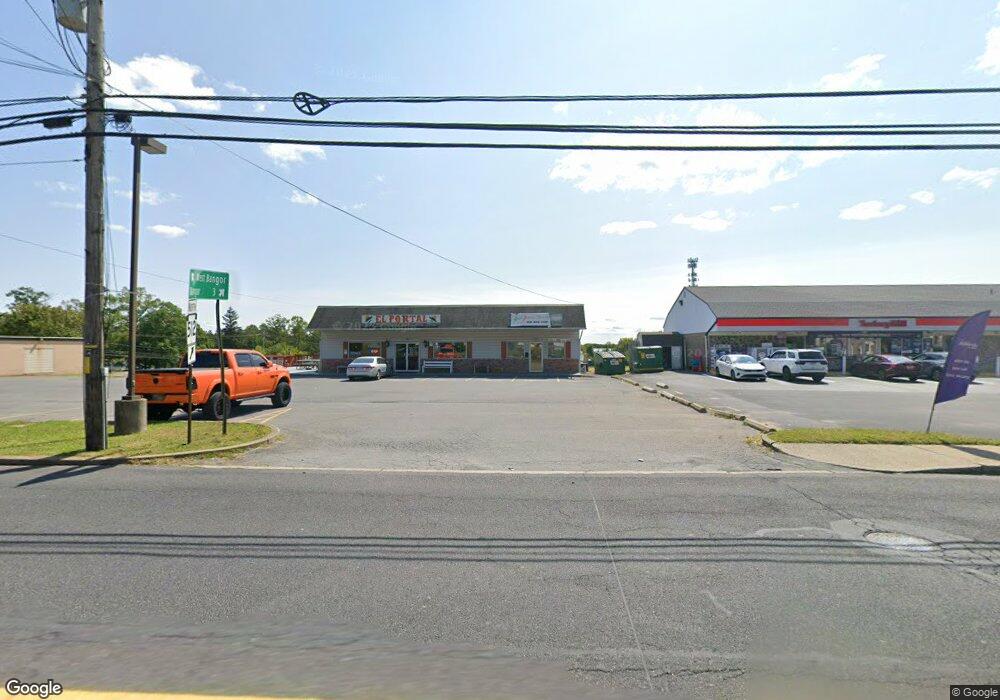
490 E Main St Pen Argyl, PA 18072
Estimated Value: $349,441
--
Bed
1
Bath
2,322
Sq Ft
$150/Sq Ft
Est. Value
About This Home
This home is located at 490 E Main St, Pen Argyl, PA 18072 and is currently estimated at $349,441, approximately $150 per square foot. 490 E Main St is a home located in Northampton County with nearby schools including Plainfield Elementary School, Wind Gap Middle School, and Pen Argyl Area High School.
Ownership History
Date
Name
Owned For
Owner Type
Purchase Details
Closed on
Apr 23, 2021
Sold by
Zanite Llc
Bought by
Mar Enterprise Ofpa Llc
Current Estimated Value
Home Financials for this Owner
Home Financials are based on the most recent Mortgage that was taken out on this home.
Original Mortgage
$187,500
Outstanding Balance
$23,350
Interest Rate
3%
Mortgage Type
Purchase Money Mortgage
Estimated Equity
$326,091
Purchase Details
Closed on
Jul 28, 2016
Sold by
Estate Of James P Corvino and Corvino Bonnie G
Bought by
Zanite Llc
Home Financials for this Owner
Home Financials are based on the most recent Mortgage that was taken out on this home.
Original Mortgage
$228,000
Interest Rate
3.56%
Mortgage Type
Commercial
Purchase Details
Closed on
Aug 1, 1992
Bought by
Marsh Scott W
Purchase Details
Closed on
Mar 1, 1990
Bought by
Not Provided
Create a Home Valuation Report for This Property
The Home Valuation Report is an in-depth analysis detailing your home's value as well as a comparison with similar homes in the area
Home Values in the Area
Average Home Value in this Area
Purchase History
| Date | Buyer | Sale Price | Title Company |
|---|---|---|---|
| Mar Enterprise Ofpa Llc | $250,000 | Quaint Oak Abstract Llc | |
| Zanite Llc | $285,000 | None Available | |
| Marsh Scott W | -- | -- | |
| Not Provided | -- | -- |
Source: Public Records
Mortgage History
| Date | Status | Borrower | Loan Amount |
|---|---|---|---|
| Open | Mar Enterprise Ofpa Llc | $187,500 | |
| Previous Owner | Zanite Llc | $228,000 |
Source: Public Records
Tax History Compared to Growth
Tax History
| Year | Tax Paid | Tax Assessment Tax Assessment Total Assessment is a certain percentage of the fair market value that is determined by local assessors to be the total taxable value of land and additions on the property. | Land | Improvement |
|---|---|---|---|---|
| 2025 | $1,138 | $105,400 | $25,000 | $80,400 |
| 2024 | $8,523 | $105,400 | $25,000 | $80,400 |
| 2023 | $8,523 | $105,400 | $25,000 | $80,400 |
| 2022 | $8,417 | $105,400 | $25,000 | $80,400 |
| 2021 | $8,523 | $105,400 | $25,000 | $80,400 |
| 2020 | $8,523 | $105,400 | $25,000 | $80,400 |
| 2019 | $8,304 | $105,400 | $25,000 | $80,400 |
| 2018 | $8,025 | $105,400 | $25,000 | $80,400 |
| 2017 | $7,872 | $105,400 | $25,000 | $80,400 |
| 2016 | -- | $105,400 | $25,000 | $80,400 |
| 2015 | -- | $105,400 | $25,000 | $80,400 |
| 2014 | -- | $105,400 | $25,000 | $80,400 |
Source: Public Records
Map
Nearby Homes
- 248 E Main St
- 312 N Robinson Ave
- 101 E Plainfield Ave
- 106 W Pennsylvania Ave
- 109 Pen Argyl St
- 500 W Pennsylvania Ave
- 533 W Pennsylvania Ave
- 639 George St
- 195 Bangor Junction Rd
- 855 Constitution Ave
- 913 Constitution Ave
- 2039 W Bangor Rd
- 120 Front St
- 402 N 8th St
- 524 N 7th St
- 602 Shawnee St
- 600 Shawnee St
- 226 N 7th St
- 603 Shawnee St
- 6 Dante St