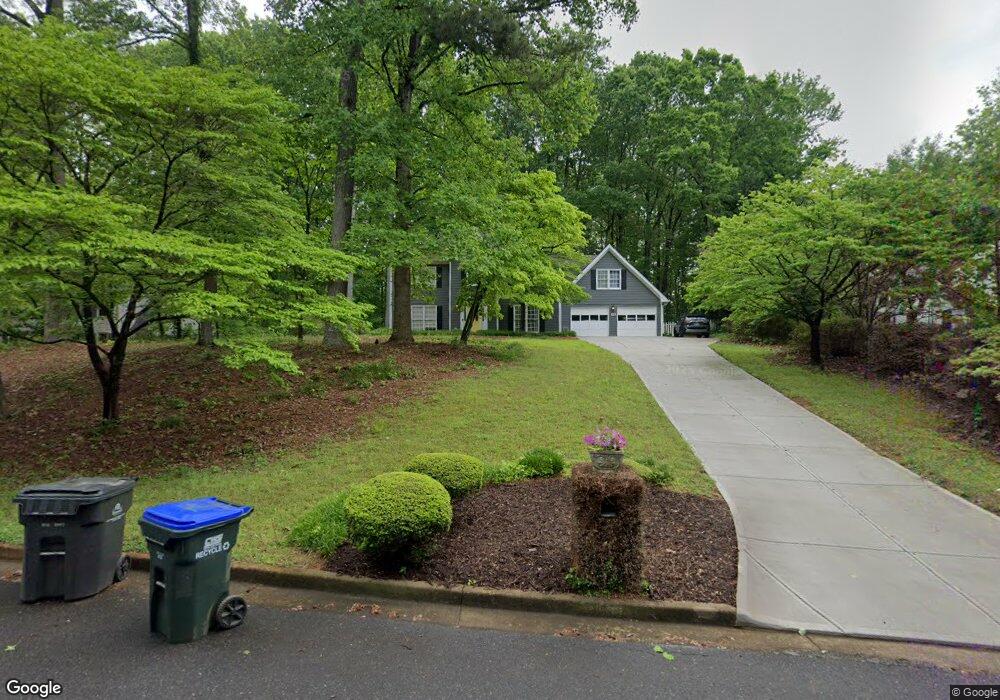
490 Hembree Hollow Roswell, GA 30076
Estimated Value: $631,000 - $655,896
4
Beds
3
Baths
2,997
Sq Ft
$216/Sq Ft
Est. Value
About This Home
This home is located at 490 Hembree Hollow, Roswell, GA 30076 and is currently estimated at $645,974, approximately $215 per square foot. 490 Hembree Hollow is a home located in Fulton County with nearby schools including Hembree Springs Elementary School, Elkins Pointe Middle School, and Milton High School.
Ownership History
Date
Name
Owned For
Owner Type
Purchase Details
Closed on
Apr 11, 2016
Sold by
Edwards Bradley H
Bought by
Mcneil Lindsey M and Mcneil Alexander B
Current Estimated Value
Home Financials for this Owner
Home Financials are based on the most recent Mortgage that was taken out on this home.
Original Mortgage
$301,500
Outstanding Balance
$239,523
Interest Rate
3.68%
Mortgage Type
New Conventional
Estimated Equity
$406,451
Purchase Details
Closed on
Mar 19, 2003
Sold by
Cendant Mobility Govt Finl
Bought by
Edwards Bradley H and Edwards Bridget
Home Financials for this Owner
Home Financials are based on the most recent Mortgage that was taken out on this home.
Original Mortgage
$206,670
Interest Rate
5.86%
Purchase Details
Closed on
Jan 8, 2003
Sold by
Emerzian Peter C and Emerzian Shirley M
Bought by
Cendant Mobility Fin'L Corp
Create a Home Valuation Report for This Property
The Home Valuation Report is an in-depth analysis detailing your home's value as well as a comparison with similar homes in the area
Home Values in the Area
Average Home Value in this Area
Purchase History
| Date | Buyer | Sale Price | Title Company |
|---|---|---|---|
| Mcneil Lindsey M | $335,000 | -- | |
| Edwards Bradley H | $204,900 | -- | |
| Cendant Mobility Fin'L Corp | $215,000 | -- |
Source: Public Records
Mortgage History
| Date | Status | Borrower | Loan Amount |
|---|---|---|---|
| Open | Mcneil Lindsey M | $301,500 | |
| Previous Owner | Edwards Bradley H | $206,670 |
Source: Public Records
Tax History Compared to Growth
Tax History
| Year | Tax Paid | Tax Assessment Tax Assessment Total Assessment is a certain percentage of the fair market value that is determined by local assessors to be the total taxable value of land and additions on the property. | Land | Improvement |
|---|---|---|---|---|
| 2025 | $684 | $172,600 | $56,080 | $116,520 |
| 2023 | $4,880 | $172,880 | $55,840 | $117,040 |
| 2022 | $2,786 | $155,960 | $38,200 | $117,760 |
| 2021 | $3,315 | $152,960 | $26,280 | $126,680 |
| 2020 | $3,365 | $151,160 | $25,960 | $125,200 |
| 2019 | $549 | $124,440 | $27,880 | $96,560 |
| 2018 | $2,950 | $121,520 | $27,240 | $94,280 |
| 2017 | $2,735 | $105,680 | $17,640 | $88,040 |
| 2016 | $2,700 | $105,680 | $17,640 | $88,040 |
| 2015 | $3,286 | $105,680 | $17,640 | $88,040 |
| 2014 | $2,552 | $96,000 | $16,040 | $79,960 |
Source: Public Records
Map
Nearby Homes
- 200 Welford Trace
- 775 Upper Hembree Rd
- 300 Saddle Creek Ln
- 755 Anna Ln
- 11925 Stradford Wood
- 1010 Blue Indigo Dr
- 12250 Broadwell Rd
- 565 Camber Woods Dr
- 1110 Arya Dr
- 530 Camber Woods Dr
- 160 Watermill Falls
- 165 Foe Creek Ct
- 1040 Jordan Ln
- 5065 Jonquilla Dr
- 1115 Primrose Dr
- 1270 Taylor Oaks Dr
- 290 Rucker Rd
- 230 Bluff Oak Dr
- 910 Reece Rd
- 1110 Upper Hembree Rd
- 480 Hembree Hollow
- 500 Hembree Hollow
- 190 Hembree Circle Dr
- 470 Hembree Hollow
- 510 Hembree Hollow
- 170 Hembree Circle Dr Unit 3
- 505 Hembree Hollow
- 495 Hembree Hollow Unit 3
- 160 Hembree Circle Dr
- 520 Hembree Hollow Unit 3
- 485 Hembree Hollow
- 515 Hembree Hollow
- 0 Hembree Hollow Unit 8625460
- 0 Hembree Hollow Unit 8032862
- 0 Hembree Hollow Unit 7597906
- 0 Hembree Hollow Unit 8260608
- 0 Hembree Hollow Unit 8455420
- 0 Hembree Hollow Unit 7268168
- 450 Hembree Hollow
- 400 Hembree Hollow