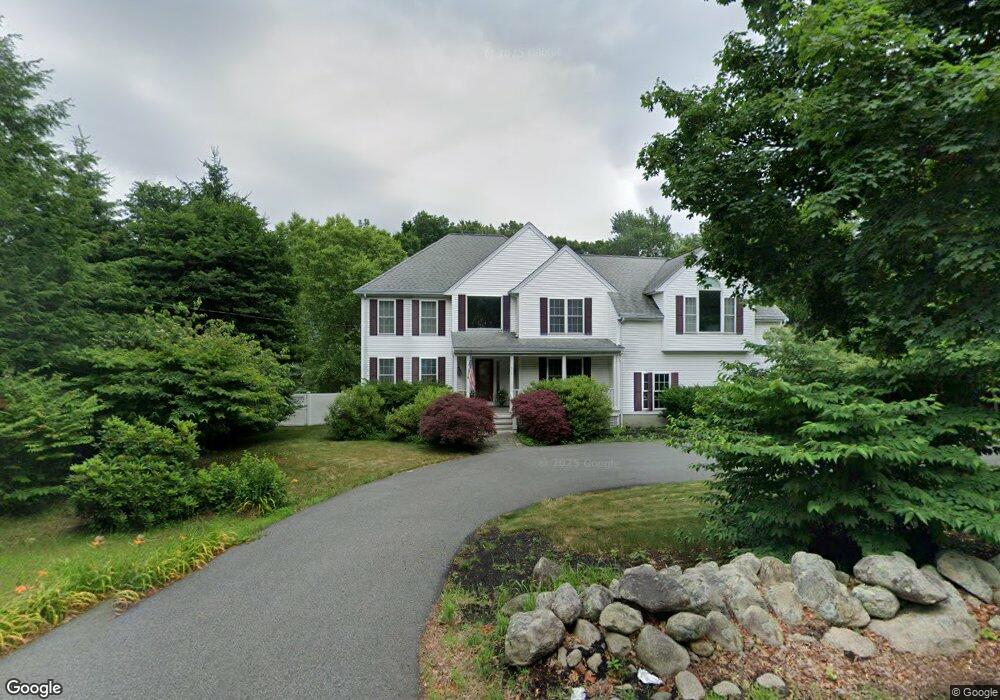
490 High St Abington, MA 02351
Estimated Value: $909,000 - $1,166,000
5
Beds
4
Baths
3,302
Sq Ft
$300/Sq Ft
Est. Value
About This Home
This home is located at 490 High St, Abington, MA 02351 and is currently estimated at $990,239, approximately $299 per square foot. 490 High St is a home located in Plymouth County with nearby schools including Beaver Brook Elementary School, Abington Middle School, and Woodsdale School.
Ownership History
Date
Name
Owned For
Owner Type
Purchase Details
Closed on
Dec 29, 2010
Sold by
Mccann James M and Mcann James
Bought by
Trout Daniel K and Trout Cristy J
Current Estimated Value
Home Financials for this Owner
Home Financials are based on the most recent Mortgage that was taken out on this home.
Original Mortgage
$373,600
Outstanding Balance
$246,787
Interest Rate
4.37%
Mortgage Type
Purchase Money Mortgage
Estimated Equity
$743,452
Purchase Details
Closed on
Apr 3, 2001
Sold by
Davey Dorothy
Bought by
High St Rt
Create a Home Valuation Report for This Property
The Home Valuation Report is an in-depth analysis detailing your home's value as well as a comparison with similar homes in the area
Home Values in the Area
Average Home Value in this Area
Purchase History
| Date | Buyer | Sale Price | Title Company |
|---|---|---|---|
| Trout Daniel K | $467,000 | -- | |
| High St Rt | $135,000 | -- |
Source: Public Records
Mortgage History
| Date | Status | Borrower | Loan Amount |
|---|---|---|---|
| Open | Trout Daniel K | $373,600 |
Source: Public Records
Tax History Compared to Growth
Tax History
| Year | Tax Paid | Tax Assessment Tax Assessment Total Assessment is a certain percentage of the fair market value that is determined by local assessors to be the total taxable value of land and additions on the property. | Land | Improvement |
|---|---|---|---|---|
| 2025 | $11,589 | $887,400 | $260,500 | $626,900 |
| 2024 | $11,625 | $868,800 | $259,400 | $609,400 |
| 2023 | $10,937 | $769,700 | $226,800 | $542,900 |
| 2022 | $10,984 | $721,700 | $190,500 | $531,200 |
| 2021 | $10,119 | $614,000 | $181,900 | $432,100 |
| 2020 | $10,032 | $590,100 | $168,700 | $421,400 |
| 2019 | $10,279 | $591,100 | $168,700 | $422,400 |
| 2018 | $0 | $545,300 | $168,700 | $376,600 |
| 2017 | $9,826 | $535,500 | $168,700 | $366,800 |
| 2016 | $9,060 | $505,300 | $154,500 | $350,800 |
| 2015 | $8,497 | $499,800 | $154,500 | $345,300 |
Source: Public Records
Map
Nearby Homes