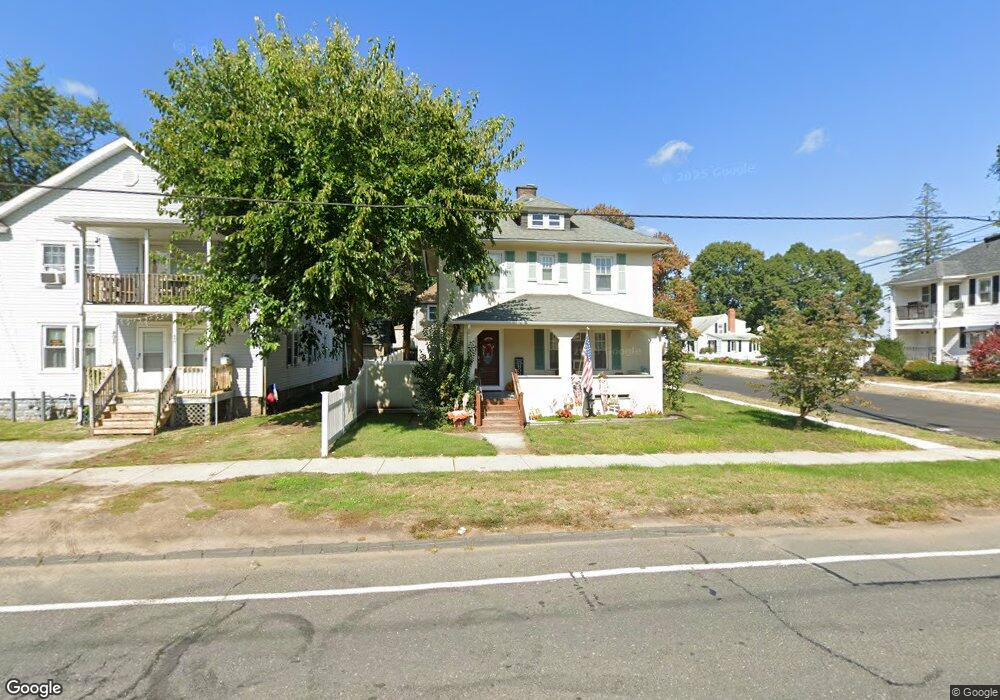
490 Kings Hwy West Springfield, MA 01089
Estimated Value: $316,949 - $335,000
3
Beds
1
Bath
1,382
Sq Ft
$237/Sq Ft
Est. Value
About This Home
This home is located at 490 Kings Hwy, West Springfield, MA 01089 and is currently estimated at $326,987, approximately $236 per square foot. 490 Kings Hwy is a home located in Hampden County with nearby schools including St Thomas The Apostle School.
Ownership History
Date
Name
Owned For
Owner Type
Purchase Details
Closed on
Sep 29, 2006
Sold by
Seajay Group Llc
Bought by
Linnehan John F and Linnehan Gabriele E
Current Estimated Value
Home Financials for this Owner
Home Financials are based on the most recent Mortgage that was taken out on this home.
Original Mortgage
$152,400
Interest Rate
6.52%
Mortgage Type
Purchase Money Mortgage
Purchase Details
Closed on
Jan 24, 2006
Sold by
Aurora Loan Svcs Inc and Davy Judith Ann
Bought by
Seajay Group Llc
Purchase Details
Closed on
Aug 10, 1988
Sold by
Stefanowich John
Bought by
Davy Ronald
Home Financials for this Owner
Home Financials are based on the most recent Mortgage that was taken out on this home.
Original Mortgage
$113,120
Interest Rate
10.34%
Mortgage Type
Purchase Money Mortgage
Create a Home Valuation Report for This Property
The Home Valuation Report is an in-depth analysis detailing your home's value as well as a comparison with similar homes in the area
Home Values in the Area
Average Home Value in this Area
Purchase History
| Date | Buyer | Sale Price | Title Company |
|---|---|---|---|
| Linnehan John F | $190,500 | -- | |
| Seajay Group Llc | $120,000 | -- | |
| Davy Ronald | $112,000 | -- |
Source: Public Records
Mortgage History
| Date | Status | Borrower | Loan Amount |
|---|---|---|---|
| Open | Davy Ronald | $208,465 | |
| Closed | Linnehan John F | $152,400 | |
| Closed | Linnehan John F | $38,100 | |
| Previous Owner | Davy Ronald | $113,120 |
Source: Public Records
Tax History Compared to Growth
Tax History
| Year | Tax Paid | Tax Assessment Tax Assessment Total Assessment is a certain percentage of the fair market value that is determined by local assessors to be the total taxable value of land and additions on the property. | Land | Improvement |
|---|---|---|---|---|
| 2025 | $4,217 | $283,600 | $111,400 | $172,200 |
| 2024 | $4,012 | $270,900 | $111,400 | $159,500 |
| 2023 | $3,873 | $249,200 | $111,400 | $137,800 |
| 2022 | $3,544 | $224,900 | $101,100 | $123,800 |
| 2021 | $3,177 | $188,000 | $78,800 | $109,200 |
| 2020 | $3,194 | $188,000 | $78,800 | $109,200 |
| 2019 | $3,188 | $188,000 | $78,800 | $109,200 |
| 2018 | $3,205 | $188,000 | $78,800 | $109,200 |
| 2017 | $3,205 | $188,000 | $78,800 | $109,200 |
| 2016 | $3,148 | $185,300 | $74,100 | $111,200 |
| 2015 | $3,089 | $181,800 | $72,600 | $109,200 |
| 2014 | $749 | $181,800 | $72,600 | $109,200 |
Source: Public Records
Map
Nearby Homes