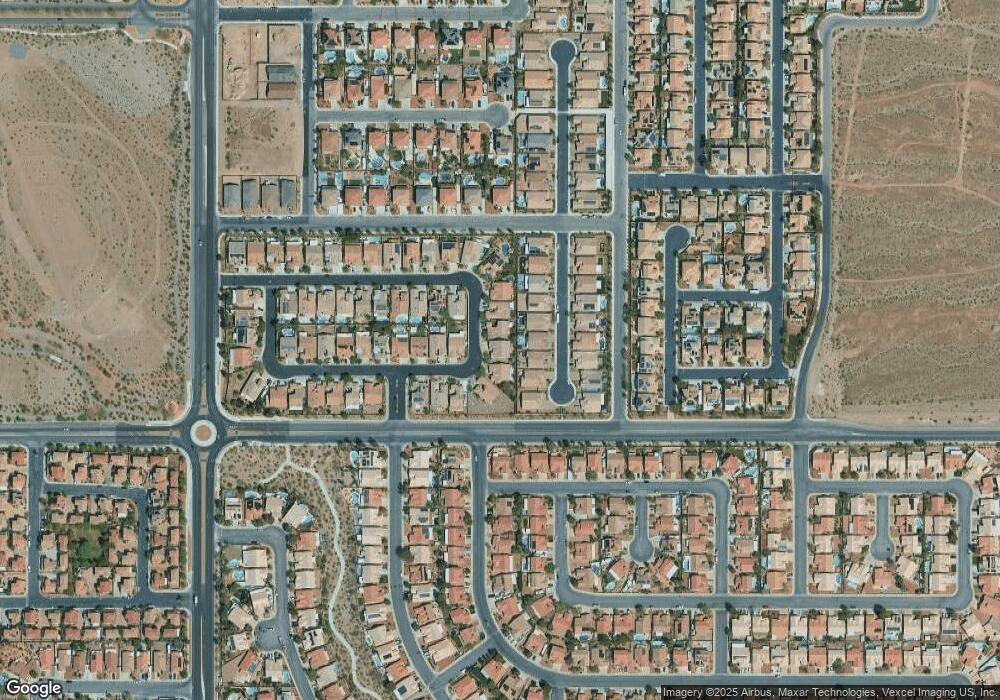
490 Lynnhaven St Henderson, NV 89015
Foothills NeighborhoodEstimated Value: $519,489 - $581,000
3
Beds
2
Baths
2,161
Sq Ft
$253/Sq Ft
Est. Value
About This Home
This home is located at 490 Lynnhaven St, Henderson, NV 89015 and is currently estimated at $546,372, approximately $252 per square foot. 490 Lynnhaven St is a home located in Clark County with nearby schools including Sue H. Morrow Elementary School, B Mahlon Brown Academy of International Studies, and Basic Academy of International Studies.
Ownership History
Date
Name
Owned For
Owner Type
Purchase Details
Closed on
Aug 15, 2003
Sold by
Beazer Homes Holdings Corp
Bought by
Villanueva Victor M and Villanueva Buenafe A
Current Estimated Value
Home Financials for this Owner
Home Financials are based on the most recent Mortgage that was taken out on this home.
Original Mortgage
$234,150
Outstanding Balance
$102,960
Interest Rate
5.6%
Mortgage Type
Unknown
Estimated Equity
$443,412
Create a Home Valuation Report for This Property
The Home Valuation Report is an in-depth analysis detailing your home's value as well as a comparison with similar homes in the area
Home Values in the Area
Average Home Value in this Area
Purchase History
| Date | Buyer | Sale Price | Title Company |
|---|---|---|---|
| Villanueva Victor M | $246,475 | Lawyers Title Of Nevada |
Source: Public Records
Mortgage History
| Date | Status | Borrower | Loan Amount |
|---|---|---|---|
| Open | Villanueva Victor M | $234,150 |
Source: Public Records
Tax History Compared to Growth
Tax History
| Year | Tax Paid | Tax Assessment Tax Assessment Total Assessment is a certain percentage of the fair market value that is determined by local assessors to be the total taxable value of land and additions on the property. | Land | Improvement |
|---|---|---|---|---|
| 2025 | $1,939 | $136,816 | $39,200 | $97,616 |
| 2024 | $1,884 | $136,816 | $39,200 | $97,616 |
| 2023 | $1,884 | $128,353 | $36,400 | $91,953 |
| 2022 | $1,829 | $117,733 | $33,600 | $84,133 |
| 2021 | $1,776 | $111,676 | $31,850 | $79,826 |
| 2020 | $1,721 | $106,996 | $28,000 | $78,996 |
| 2019 | $1,671 | $102,859 | $25,200 | $77,659 |
| 2018 | $1,622 | $99,315 | $24,500 | $74,815 |
| 2017 | $2,856 | $98,533 | $21,700 | $76,833 |
| 2016 | $1,537 | $76,154 | $14,000 | $62,154 |
| 2015 | $1,533 | $68,422 | $14,000 | $54,422 |
| 2014 | $1,486 | $49,750 | $11,200 | $38,550 |
Source: Public Records
Map
Nearby Homes
- 321 Blossom Wind St
- 1008 New Creek Ave
- 1064 Pincay Dr
- 368 Calabria Beach St
- 0 Racetrack and Venice Unit 2697703
- 368 Misty Moonlight St
- 1104 Pincay Dr
- 1125 Gallant Fox Ave
- 551 Duran St
- 343 Milan St
- 315 S Lisbon St
- 332 Milan St
- 991 Hidden Meadow Ave
- 1029 Venice Ave
- Dawson Plan at Montview Estates
- Everett Plan at Montview Estates
- Spring Plan at Montview Estates
- 508 Breezy Orchard St
- 916 Twinkling Sky Ave
- 915 Graceful Moon Ave
- 486 Lynnhaven St
- 494 Lynnhaven St
- 433 Calabria Beach St
- 437 Calabria Beach St
- 437 Calabria Beach St Unit Lot 32
- 482 Lynnhaven St
- 1044 Island Falls Ave
- 429 Calabria Beach St Unit Lot 34
- 441 Calabria Beach St
- 1049 Island Falls Ave
- 425 Calabria Beach St
- 478 Lynnhaven St
- 1051 New Creek Ave
- 1040 Island Falls Ave
- 1045 Island Falls Ave
- 445 Calabria Beach St Unit Lot 30
- 421 Calabria Beach St
- 1047 New Creek Ave
- 1041 Island Falls Ave
- 1036 Island Falls Ave
