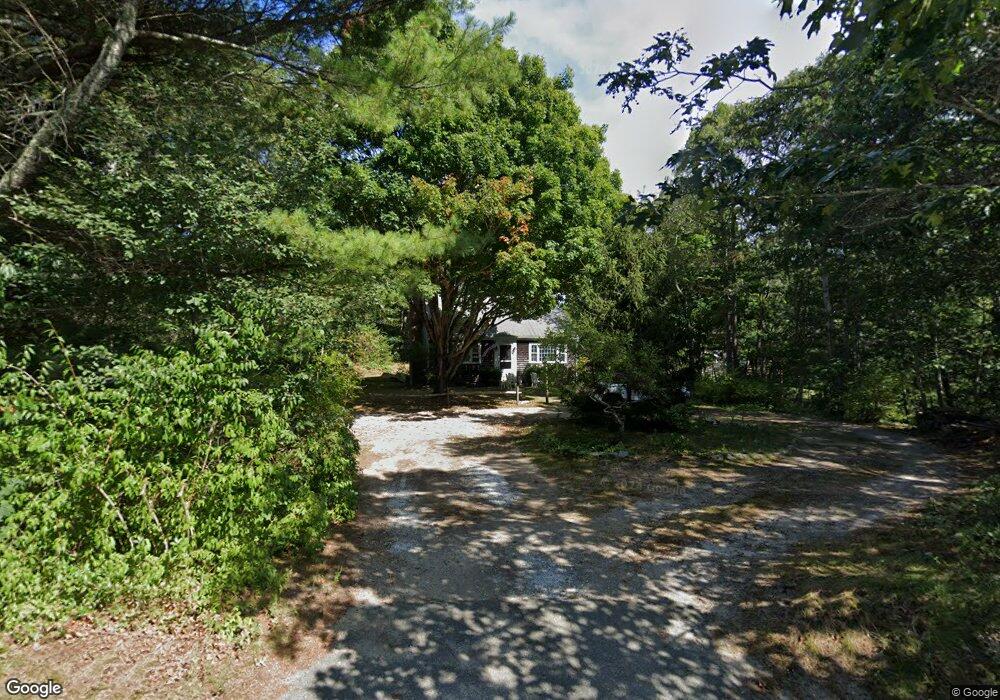
490 N Dennis Rd Yarmouth Port, MA 02675
Yarmouth Port NeighborhoodEstimated Value: $569,000 - $642,000
3
Beds
3
Baths
1,152
Sq Ft
$512/Sq Ft
Est. Value
About This Home
This home is located at 490 N Dennis Rd, Yarmouth Port, MA 02675 and is currently estimated at $589,765, approximately $511 per square foot. 490 N Dennis Rd is a home located in Barnstable County with nearby schools including Dennis-Yarmouth Regional High School and St. Pius X. School.
Ownership History
Date
Name
Owned For
Owner Type
Purchase Details
Closed on
Nov 16, 1990
Sold by
Giett Ethel M
Bought by
Brown Douglas L
Current Estimated Value
Home Financials for this Owner
Home Financials are based on the most recent Mortgage that was taken out on this home.
Original Mortgage
$86,200
Interest Rate
10.03%
Mortgage Type
Purchase Money Mortgage
Create a Home Valuation Report for This Property
The Home Valuation Report is an in-depth analysis detailing your home's value as well as a comparison with similar homes in the area
Home Values in the Area
Average Home Value in this Area
Purchase History
| Date | Buyer | Sale Price | Title Company |
|---|---|---|---|
| Brown Douglas L | $85,000 | -- |
Source: Public Records
Mortgage History
| Date | Status | Borrower | Loan Amount |
|---|---|---|---|
| Open | Brown Douglas L | $102,000 | |
| Closed | Brown Douglas L | $86,000 | |
| Closed | Brown Douglas L | $86,200 |
Source: Public Records
Tax History Compared to Growth
Tax History
| Year | Tax Paid | Tax Assessment Tax Assessment Total Assessment is a certain percentage of the fair market value that is determined by local assessors to be the total taxable value of land and additions on the property. | Land | Improvement |
|---|---|---|---|---|
| 2025 | $3,011 | $425,300 | $162,500 | $262,800 |
| 2024 | $3,009 | $407,700 | $171,800 | $235,900 |
| 2023 | $3,062 | $377,600 | $153,500 | $224,100 |
| 2022 | $2,872 | $312,900 | $138,400 | $174,500 |
| 2021 | $2,852 | $298,300 | $138,400 | $159,900 |
| 2020 | $2,806 | $280,600 | $139,800 | $140,800 |
| 2019 | $2,663 | $263,700 | $139,800 | $123,900 |
| 2018 | $2,447 | $237,800 | $113,900 | $123,900 |
| 2017 | $2,383 | $237,800 | $113,900 | $123,900 |
| 2016 | $2,270 | $227,500 | $103,600 | $123,900 |
| 2015 | $2,177 | $216,800 | $103,600 | $113,200 |
Source: Public Records
Map
Nearby Homes
- 13 Covey Dr
- 6 Nimble Hill Dr
- 111 Merchant Ave
- 59 Main St Unit 19-2
- 59 Route 6a Unit 29-4
- 4 Ebb Rd
- 153 Bayridge Dr
- 11 Uncle Stanleys Way
- 44 Stratford Ln
- 51 Bray Farm Rd N
- 268 Main St
- 26 Olivia Walker Way
- 15 Captain Jud Rd
- 118 Driftwood Ln
- 64 Kates Path
- 34 Kates Path
- 34 Kates Path Unit 34
- 43 Canterbury Rd
- 86 Pompano Rd