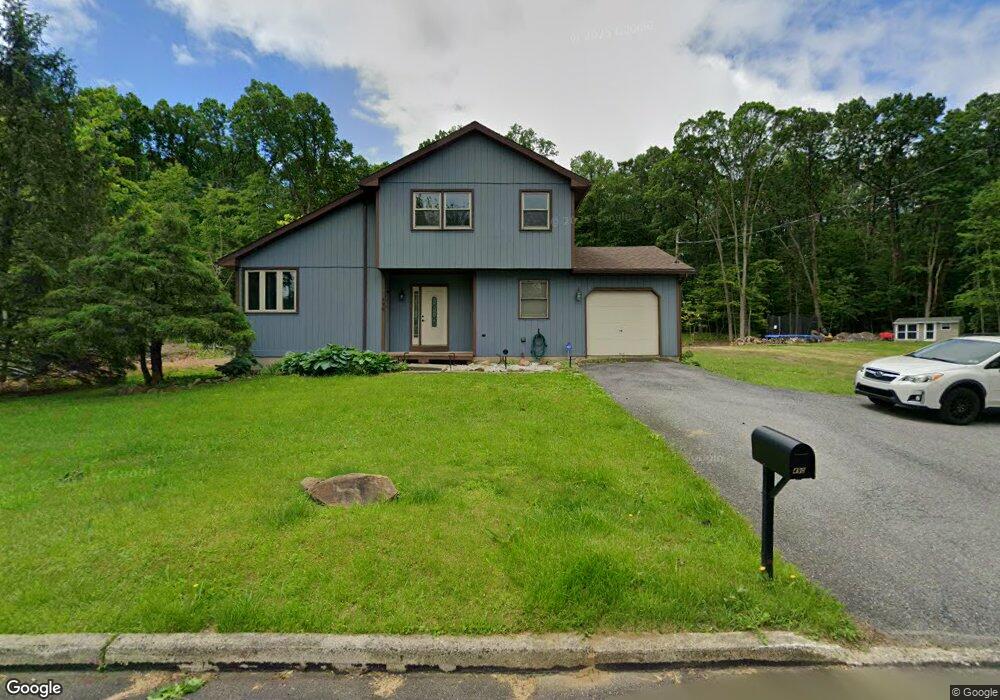
490 Thomas St Alburtis, PA 18011
Lower Macungie Township West NeighborhoodEstimated Value: $355,071 - $420,000
3
Beds
2
Baths
1,366
Sq Ft
$284/Sq Ft
Est. Value
About This Home
This home is located at 490 Thomas St, Alburtis, PA 18011 and is currently estimated at $387,268, approximately $283 per square foot. 490 Thomas St is a home located in Lehigh County with nearby schools including Alburtis Elementary School, Lower Macungie Middle School, and Emmaus High School.
Ownership History
Date
Name
Owned For
Owner Type
Purchase Details
Closed on
Apr 19, 2010
Sold by
Reinert Eric D
Bought by
Pavlik Michael L
Current Estimated Value
Home Financials for this Owner
Home Financials are based on the most recent Mortgage that was taken out on this home.
Original Mortgage
$237,586
Outstanding Balance
$158,240
Interest Rate
5%
Mortgage Type
FHA
Estimated Equity
$229,028
Purchase Details
Closed on
Dec 7, 1998
Sold by
Fatzinger Scott P and Fatzinger Ann K
Bought by
Reinert Eric D and Reinert Janet A
Purchase Details
Closed on
May 11, 1993
Sold by
Fatzinger Scott P and Kelby Ann E
Bought by
Fatzinger Scott P and Fatzinger Ann K
Purchase Details
Closed on
May 31, 1991
Sold by
Poole Tschudy F and Poole Kathleen J
Bought by
Fatzinger Scott P and Kelby Ann E
Purchase Details
Closed on
Feb 27, 1986
Bought by
Poole Tschudy F and Poole Kathleen J
Create a Home Valuation Report for This Property
The Home Valuation Report is an in-depth analysis detailing your home's value as well as a comparison with similar homes in the area
Home Values in the Area
Average Home Value in this Area
Purchase History
| Date | Buyer | Sale Price | Title Company |
|---|---|---|---|
| Pavlik Michael L | $242,000 | -- | |
| Reinert Eric D | $127,500 | -- | |
| Fatzinger Scott P | -- | -- | |
| Fatzinger Scott P | $119,000 | -- | |
| Poole Tschudy F | $74,000 | -- |
Source: Public Records
Mortgage History
| Date | Status | Borrower | Loan Amount |
|---|---|---|---|
| Open | Pavlik Michael L | $237,586 |
Source: Public Records
Tax History Compared to Growth
Tax History
| Year | Tax Paid | Tax Assessment Tax Assessment Total Assessment is a certain percentage of the fair market value that is determined by local assessors to be the total taxable value of land and additions on the property. | Land | Improvement |
|---|---|---|---|---|
| 2025 | $5,373 | $183,000 | $55,200 | $127,800 |
| 2024 | $5,236 | $183,000 | $55,200 | $127,800 |
| 2023 | $4,993 | $183,000 | $55,200 | $127,800 |
| 2022 | $4,889 | $183,000 | $127,800 | $55,200 |
| 2021 | $4,797 | $183,000 | $55,200 | $127,800 |
| 2020 | $4,756 | $183,000 | $55,200 | $127,800 |
| 2019 | $4,731 | $183,000 | $55,200 | $127,800 |
| 2018 | $4,677 | $183,000 | $55,200 | $127,800 |
| 2017 | $4,606 | $183,000 | $55,200 | $127,800 |
| 2016 | -- | $183,000 | $55,200 | $127,800 |
| 2015 | -- | $183,000 | $55,200 | $127,800 |
| 2014 | -- | $183,000 | $55,200 | $127,800 |
Source: Public Records
Map
Nearby Homes
- 428 Thomas St
- 317 Lockridge Ln
- 121 S Main St Unit 123
- 241 Flint Hill Rd
- 354 W 2nd St
- 3371 Mathews Ln
- 31 Barbara Dr
- 1108 S Barbara Dr
- 0 Clauss Hunt Knight Dr Unit 10 Units 763578
- 6903 Lincoln Dr
- 7318 Sauerkraut Ln Unit E
- 8312 Mertztown Rd
- 7230 Pioneer Dr
- 6875 Pioneer Dr
- 7528 Buttercup Rd
- 6709 Mountain Rd
- 8975 Mertztown Rd
- 0 Mountain Lot 1
- 8051 Heritage Dr
- 7699 Catalpa Dr
- 436 Thomas St
- 526 Franklin St
- 469 Thomas St
- 442 Thomas St
- 440 Thomas St
- 465 Thomas St
- 463 Thomas St
- 439 Thomas St
- 426 Thomas St
- 427 Thomas St
- 475 Thomas St
- 424 Thomas St
- 470 Franklin St
- 468 Franklin St
- 456 Franklin St
- 454 Franklin St Unit 456
- 422 Thomas St
- 423 Thomas St
- 442 Franklin St
- 440 Franklin St Unit 442