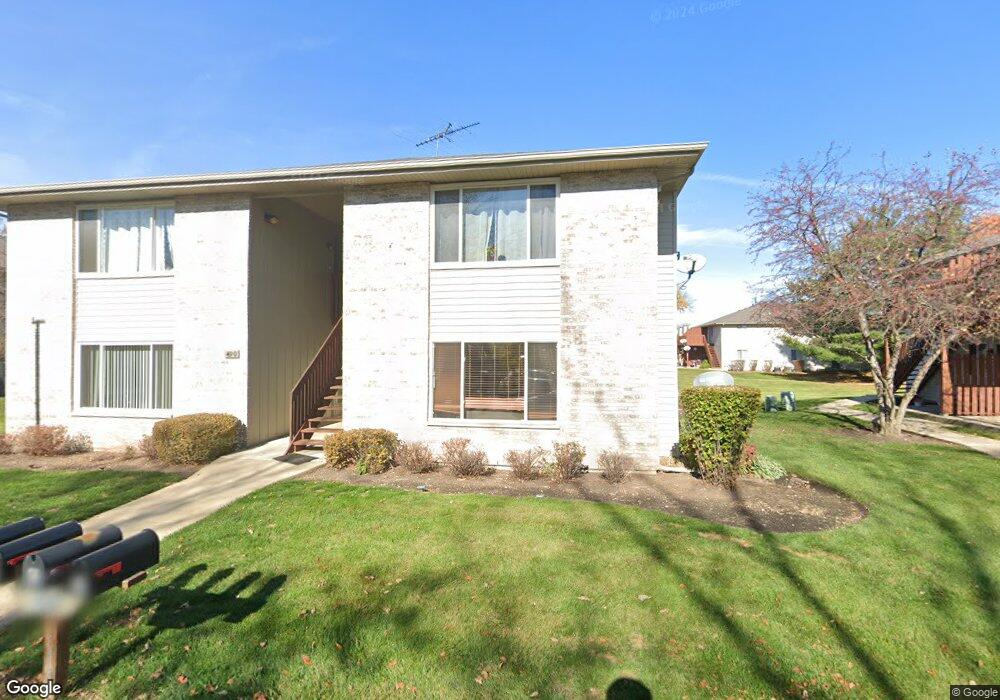
490 Westwood Ct Unit D Crystal Lake, IL 60014
Estimated Value: $186,433 - $212,000
2
Beds
2
Baths
1,248
Sq Ft
$162/Sq Ft
Est. Value
About This Home
This home is located at 490 Westwood Ct Unit D, Crystal Lake, IL 60014 and is currently estimated at $202,358, approximately $162 per square foot. 490 Westwood Ct Unit D is a home located in McHenry County with nearby schools including Coventry Elementary School, Hannah Beardsley Middle School, and Crystal Lake South High School.
Ownership History
Date
Name
Owned For
Owner Type
Purchase Details
Closed on
Jun 28, 2018
Sold by
Rusu Cornelia
Bought by
Home State Bank N A
Current Estimated Value
Purchase Details
Closed on
Mar 29, 2013
Sold by
Ardelean Michael
Bought by
Rusu Cornelia and Ardelean Cornelia
Purchase Details
Closed on
Jun 18, 2004
Sold by
Tyrrell Carolyn and Tyrrell Joseph Patrick
Bought by
Ardelean Cornelia
Home Financials for this Owner
Home Financials are based on the most recent Mortgage that was taken out on this home.
Original Mortgage
$114,000
Interest Rate
6.17%
Mortgage Type
Unknown
Purchase Details
Closed on
Aug 28, 1998
Sold by
Heimberg Richard L
Bought by
Tyrrell Carolyn
Home Financials for this Owner
Home Financials are based on the most recent Mortgage that was taken out on this home.
Original Mortgage
$93,955
Interest Rate
7.04%
Create a Home Valuation Report for This Property
The Home Valuation Report is an in-depth analysis detailing your home's value as well as a comparison with similar homes in the area
Home Values in the Area
Average Home Value in this Area
Purchase History
| Date | Buyer | Sale Price | Title Company |
|---|---|---|---|
| Home State Bank N A | -- | Attorney | |
| Rusu Cornelia | -- | None Available | |
| Ardelean Cornelia | $142,500 | Ticor | |
| Tyrrell Carolyn | $99,000 | Fox Title Company |
Source: Public Records
Mortgage History
| Date | Status | Borrower | Loan Amount |
|---|---|---|---|
| Previous Owner | Ardelean Cornelia | $114,000 | |
| Previous Owner | Tyrrell Carolyn | $93,955 | |
| Closed | Ardelean Cornelia | $21,370 |
Source: Public Records
Tax History Compared to Growth
Tax History
| Year | Tax Paid | Tax Assessment Tax Assessment Total Assessment is a certain percentage of the fair market value that is determined by local assessors to be the total taxable value of land and additions on the property. | Land | Improvement |
|---|---|---|---|---|
| 2024 | $374 | $57,027 | $12,070 | $44,957 |
| 2023 | $407 | $51,003 | $10,795 | $40,208 |
| 2022 | $892 | $42,341 | $9,743 | $32,598 |
| 2021 | $909 | $39,446 | $9,077 | $30,369 |
| 2020 | $921 | $38,050 | $8,756 | $29,294 |
| 2019 | $940 | $36,419 | $8,381 | $28,038 |
| 2018 | $959 | $30,815 | $7,742 | $23,073 |
| 2017 | $1,016 | $29,029 | $7,293 | $21,736 |
| 2016 | $1,062 | $27,226 | $6,840 | $20,386 |
| 2013 | -- | $21,314 | $6,380 | $14,934 |
Source: Public Records
Map
Nearby Homes
- 698 Sussex Ln
- 567 Cress Creek Ln
- 650 Cress Creek Ln Unit 1
- 600 Sussex Ln
- 542 Silver Aspen Cir
- 704 Saint Andrews Ln
- 894 N Brentwood Dr
- 518 Silver Aspen Cir
- 699 Darlington Ln
- 860 Darlington Ln
- 1013 Nottingham Ln
- 511 Coventry Ln Unit 2
- 511 Coventry Ln Unit 3
- 501 Coventry Ln Unit 18
- 929 Golf Course Rd Unit 4
- 584 Somerset Ln Unit 5
- 160 Surrey Ln
- 421 Lake Ave
- 863 Barlina Rd Unit 3
- 896 Canterbury Dr
- 490 Westwood Ct Unit 490B
- 490 Westwood Ct Unit C
- 490 Westwood Ct Unit A
- 480 Westwood Ct Unit 480A
- 480 Westwood Ct Unit 480C
- 480 Westwood Ct Unit B
- 480 Westwood Ct
- 480 Westwood Ct Unit C
- 480 Westwood Ct Unit A
- 500 Westwood Ct Unit 500C
- 500 Westwood Ct Unit 500B
- 500 Westwood Ct Unit A
- 500 Westwood Ct Unit D
- 500 Westwood Ct Unit C
- 500 Westwood Ct Unit B
- 470 Westwood Ct Unit D
- 470 Westwood Ct Unit A
- 470 Westwood Ct Unit C
- 470 Westwood Ct Unit B
- 470 Westwood Ct