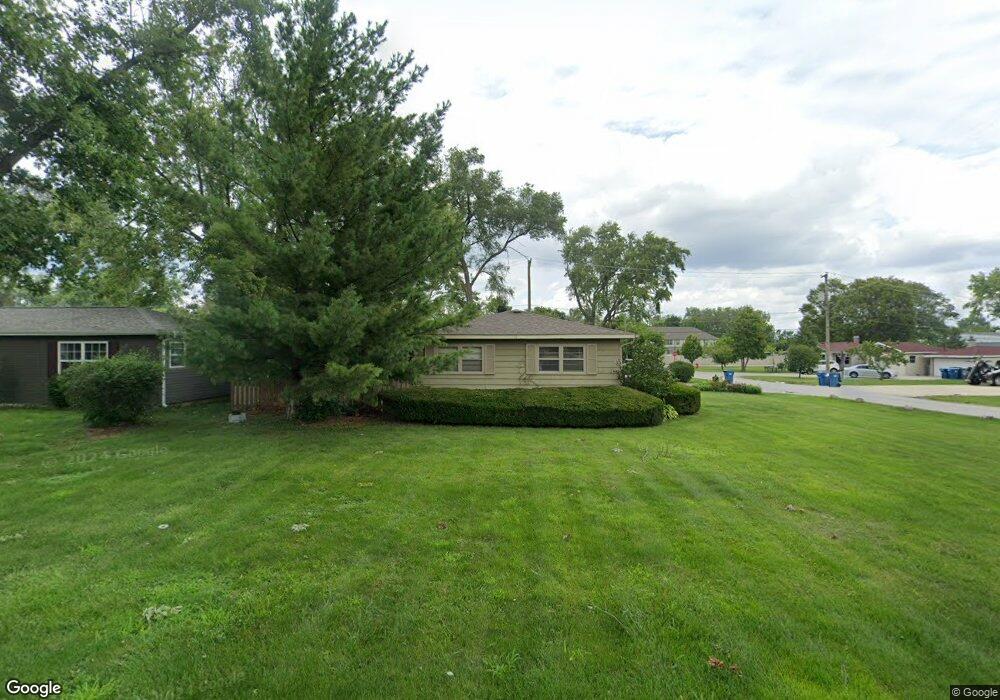
4900 144th St Midlothian, IL 60445
Estimated Value: $228,000 - $285,000
3
Beds
1
Bath
1,396
Sq Ft
$182/Sq Ft
Est. Value
About This Home
This home is located at 4900 144th St, Midlothian, IL 60445 and is currently estimated at $254,013, approximately $181 per square foot. 4900 144th St is a home located in Cook County with nearby schools including Kerkstra Elementary School, Jack Hille Middle School, and Oak Forest High School.
Ownership History
Date
Name
Owned For
Owner Type
Purchase Details
Closed on
May 3, 2013
Sold by
Riddering Susan Marie and Riddering Richard
Bought by
Jones Jillian
Current Estimated Value
Home Financials for this Owner
Home Financials are based on the most recent Mortgage that was taken out on this home.
Original Mortgage
$143,355
Outstanding Balance
$101,674
Interest Rate
3.5%
Mortgage Type
FHA
Estimated Equity
$152,339
Purchase Details
Closed on
Feb 24, 2000
Sold by
Michalek Donald and Michalek Carole
Bought by
Henson Susan M
Home Financials for this Owner
Home Financials are based on the most recent Mortgage that was taken out on this home.
Original Mortgage
$115,900
Interest Rate
8.21%
Create a Home Valuation Report for This Property
The Home Valuation Report is an in-depth analysis detailing your home's value as well as a comparison with similar homes in the area
Home Values in the Area
Average Home Value in this Area
Purchase History
| Date | Buyer | Sale Price | Title Company |
|---|---|---|---|
| Jones Jillian | $146,000 | Fidelity National Title | |
| Henson Susan M | $122,000 | -- |
Source: Public Records
Mortgage History
| Date | Status | Borrower | Loan Amount |
|---|---|---|---|
| Open | Jones Jillian | $143,355 | |
| Previous Owner | Henson Susan M | $115,900 |
Source: Public Records
Tax History Compared to Growth
Tax History
| Year | Tax Paid | Tax Assessment Tax Assessment Total Assessment is a certain percentage of the fair market value that is determined by local assessors to be the total taxable value of land and additions on the property. | Land | Improvement |
|---|---|---|---|---|
| 2024 | $4,908 | $17,000 | $4,014 | $12,986 |
| 2023 | $4,538 | $17,000 | $4,014 | $12,986 |
| 2022 | $4,538 | $13,208 | $3,513 | $9,695 |
| 2021 | $4,451 | $13,206 | $3,512 | $9,694 |
| 2020 | $4,365 | $13,206 | $3,512 | $9,694 |
| 2019 | $4,402 | $13,542 | $3,261 | $10,281 |
| 2018 | $4,312 | $13,542 | $3,261 | $10,281 |
| 2017 | $4,203 | $13,542 | $3,261 | $10,281 |
| 2016 | $5,060 | $11,808 | $2,759 | $9,049 |
| 2015 | $4,945 | $11,808 | $2,759 | $9,049 |
| 2014 | $4,797 | $11,808 | $2,759 | $9,049 |
| 2013 | $3,581 | $12,538 | $2,759 | $9,779 |
Source: Public Records
Map
Nearby Homes
- 14457 Lamon Ave Unit 3N
- 14137 Kilpatrick Ave
- 14341 Kenton Ave
- 4653 146th St
- 14602 Kenton Ave
- 5018 Midlothian Turnpike Unit 1009
- 14603 Kenton Ave
- 14317 Kilbourne Ave
- 14704 Kenton Ave
- 14710 Kenton Ave
- 5041 139th Place Unit 406
- 13919 W Leamington Dr Unit 806
- 14840 Kilpatrick Ave Unit 604
- 14244 Kostner Ave
- 14305 Kostner Ave
- 14833 Kilpatrick Ave
- 14815 Kenton Ave Unit 1
- 14632 Kostner Ave
- 13933 James Dr Unit 816
- 14545 Kostner Ave
- 4904 144th St
- 4901 143rd Place
- 4836 144th St
- 4908 144th St
- 4905 143rd Place
- 4835 143rd Place
- 4901 144th St
- 4909 143rd Place
- 4905 144th St
- 4912 144th St
- 4832 144th St
- 14401 Lamon Ave
- 4909 144th St
- 14403 Lamon Ave
- 4831 143rd Place
- 4913 143rd Place
- 4913 143rd Place
- 14405 Lamon Ct
- 14405 Lamon Ave
- 4913 144th St