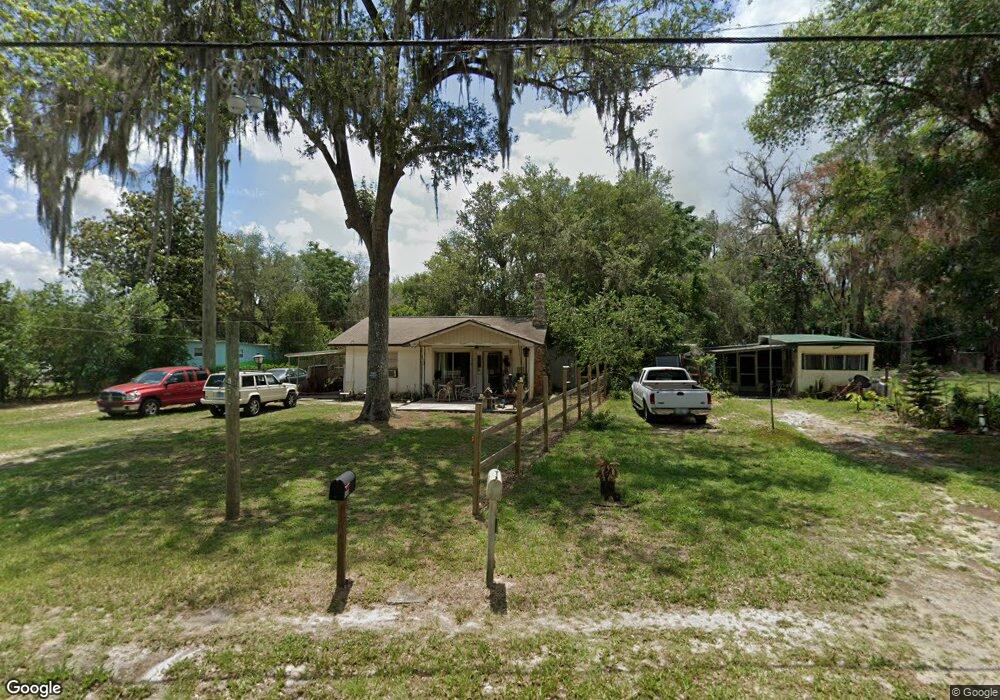
4900 E Parsons Point Rd Hernando, FL 34442
Estimated Value: $143,000 - $206,000
2
Beds
1
Bath
1,007
Sq Ft
$170/Sq Ft
Est. Value
About This Home
This home is located at 4900 E Parsons Point Rd, Hernando, FL 34442 and is currently estimated at $171,325, approximately $170 per square foot. 4900 E Parsons Point Rd is a home located in Citrus County with nearby schools including Hernando Elementary School, Citrus Springs Middle School, and Citrus High School.
Ownership History
Date
Name
Owned For
Owner Type
Purchase Details
Closed on
Feb 12, 2024
Sold by
Hoke Randy L and Hoke Barbara L
Bought by
Dallas Samuel Keith
Current Estimated Value
Purchase Details
Closed on
Dec 27, 2023
Sold by
Hoke Randy L and Hoke Barbara L
Bought by
Dallas Samuel Keith
Purchase Details
Closed on
Feb 28, 2017
Sold by
Rehm John George and Rehm Nancy L
Bought by
Hoke Randy L and Hoke Barbara L
Purchase Details
Closed on
Jul 11, 2000
Sold by
Sweatman Louis E and Sweatman Velia D
Bought by
Rehm John George and Rehm Nancy L
Purchase Details
Closed on
Oct 1, 1997
Bought by
Hoke Randy L and Hoke Barbara L
Purchase Details
Closed on
Aug 1, 1988
Bought by
Hoke Randy L and Hoke Barbara L
Purchase Details
Closed on
Feb 1, 1980
Bought by
Hoke Randy L and Hoke Barbara L
Purchase Details
Closed on
Mar 1, 1977
Bought by
Hoke Randy L and Hoke Barbara L
Create a Home Valuation Report for This Property
The Home Valuation Report is an in-depth analysis detailing your home's value as well as a comparison with similar homes in the area
Home Values in the Area
Average Home Value in this Area
Purchase History
| Date | Buyer | Sale Price | Title Company |
|---|---|---|---|
| Dallas Samuel Keith | -- | None Listed On Document | |
| Dallas Samuel Keith | -- | None Listed On Document | |
| Dallas Samuel Keith | $100 | None Listed On Document | |
| Dallas Samuel Keith | $100 | None Listed On Document | |
| Hoke Randy L | $34,000 | Precision Title The Suncoast | |
| Rehm John George | $34,200 | -- | |
| Hoke Randy L | $39,500 | -- | |
| Hoke Randy L | $36,000 | -- | |
| Hoke Randy L | $26,000 | -- | |
| Hoke Randy L | $19,500 | -- |
Source: Public Records
Tax History
| Year | Tax Paid | Tax Assessment Tax Assessment Total Assessment is a certain percentage of the fair market value that is determined by local assessors to be the total taxable value of land and additions on the property. | Land | Improvement |
|---|---|---|---|---|
| 2025 | $1,808 | $118,633 | $19,150 | $99,483 |
| 2024 | $1,278 | $110,817 | $8,800 | $102,017 |
| 2023 | $1,278 | $57,968 | $0 | $0 |
| 2022 | $1,102 | $84,653 | $8,800 | $75,853 |
| 2021 | $916 | $59,609 | $4,970 | $54,639 |
| 2020 | $820 | $57,622 | $4,970 | $52,652 |
| 2019 | $720 | $44,846 | $5,780 | $39,066 |
| 2018 | $622 | $35,994 | $5,780 | $30,214 |
| 2017 | $642 | $36,535 | $5,780 | $30,755 |
| 2016 | $651 | $36,640 | $5,780 | $30,860 |
| 2015 | $601 | $32,039 | $5,800 | $26,239 |
| 2014 | $708 | $37,220 | $6,762 | $30,458 |
Source: Public Records
Map
Nearby Homes
- 4920 E Parsons Point Rd
- 4836 E Fordham Place
- 2829 N Lakefront Dr
- 4773 E Fordham Place
- 2778 N Rutgers Terrace
- 4523 E Harvard Dr
- 3100 N Edwards Island
- 2580 N Bucknell Terrace
- 2763 N Vasser Terrace
- 2940 N Brown Point
- 2588 N Lantern Terrace
- 2562 N Lantern Terrace
- 3708 E Fair Ct
- 4029 E Walker St
- 800 N Sweet Gum Way
- 4588 E Van Ness Rd
- 2989 N Aquaview Terrace
- 4025 N Bluewater Dr
- 4480 E Van Ness Rd
- 3172 N Aquaview Terrace
- 4909 E Fordham Place
- 4901 E Fordham Place
- 4919 E Parsons Point Rd
- 4875 E Fordham Place
- 4941 E Parsons Point Rd
- 4855 E Fordham Place
- 2915 N Lakefront Dr
- 2905 N Lakefront Dr
- 4970 E Parsons Point Rd
- 2891 N Lakefront Dr
- 4818 E Parsons Point Rd
- 4866 E Fordham Place
- 4775 E Fordham Place
- 4963 E Parsons Point Rd
- 2860 N Lakefront Dr
- 4932 E Rugby Trail
- 4815 E Fordham Place
- 2848 N Lakefront Dr
- 4840 E Rugby Trail
Your Personal Tour Guide
Ask me questions while you tour the home.