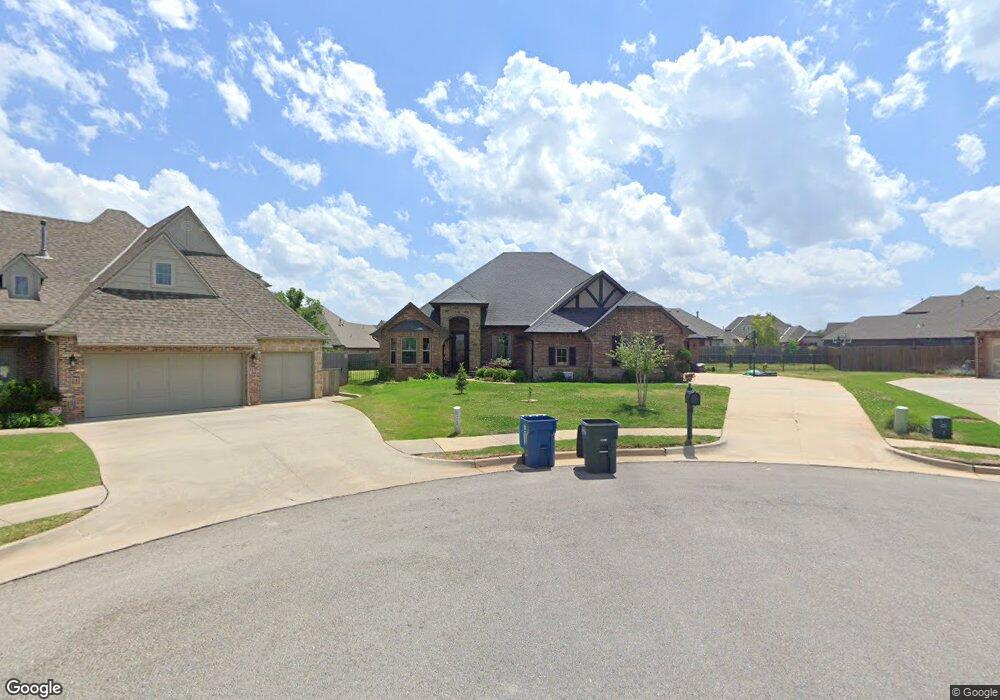
4900 Fremont Bridge Ct Edmond, OK 73034
Coffee Creek NeighborhoodEstimated Value: $573,407 - $627,000
4
Beds
4
Baths
2,978
Sq Ft
$201/Sq Ft
Est. Value
About This Home
This home is located at 4900 Fremont Bridge Ct, Edmond, OK 73034 and is currently estimated at $599,852, approximately $201 per square foot. 4900 Fremont Bridge Ct is a home with nearby schools including Heritage Elementary School, Sequoyah Middle School, and North High School.
Ownership History
Date
Name
Owned For
Owner Type
Purchase Details
Closed on
Nov 18, 2021
Sold by
Vonneumann Steven M and Von Neumann Vera
Bought by
Vonneumann Steven M and Von Neumann Vera
Current Estimated Value
Home Financials for this Owner
Home Financials are based on the most recent Mortgage that was taken out on this home.
Original Mortgage
$508,500
Outstanding Balance
$466,340
Interest Rate
3.05%
Mortgage Type
VA
Estimated Equity
$133,512
Purchase Details
Closed on
Jan 13, 2020
Sold by
Garrett Building Materials Llc
Bought by
Vonneumann Steven M and Von Neumann Vera X
Home Financials for this Owner
Home Financials are based on the most recent Mortgage that was taken out on this home.
Original Mortgage
$385,671
Interest Rate
3.6%
Mortgage Type
VA
Purchase Details
Closed on
Mar 6, 2014
Sold by
Golden Gate Development Llc
Bought by
Garrett Buildign Material Llc and Insulating Concrete Homes
Create a Home Valuation Report for This Property
The Home Valuation Report is an in-depth analysis detailing your home's value as well as a comparison with similar homes in the area
Home Values in the Area
Average Home Value in this Area
Purchase History
| Date | Buyer | Sale Price | Title Company |
|---|---|---|---|
| Vonneumann Steven M | -- | Timios Inc | |
| Vonneumann Steven M | $377,000 | Oklahoma City Abstract & Ttl | |
| Garrett Buildign Material Llc | $64,500 | None Available |
Source: Public Records
Mortgage History
| Date | Status | Borrower | Loan Amount |
|---|---|---|---|
| Open | Vonneumann Steven M | $508,500 | |
| Closed | Vonneumann Steven M | $385,671 |
Source: Public Records
Tax History Compared to Growth
Tax History
| Year | Tax Paid | Tax Assessment Tax Assessment Total Assessment is a certain percentage of the fair market value that is determined by local assessors to be the total taxable value of land and additions on the property. | Land | Improvement |
|---|---|---|---|---|
| 2024 | $4,348 | $43,995 | $7,378 | $36,617 |
| 2023 | $4,348 | $42,714 | $7,565 | $35,149 |
| 2022 | $4,235 | $41,470 | $11,123 | $30,347 |
| 2021 | $4,215 | $41,470 | $11,123 | $30,347 |
| 2020 | $4,470 | $42,405 | $11,374 | $31,031 |
| 2019 | $5,062 | $47,795 | $11,926 | $35,869 |
| 2018 | $4,981 | $46,750 | $0 | $0 |
| 2017 | $5,011 | $47,244 | $11,926 | $35,318 |
| 2016 | $1,897 | $17,920 | $541 | $17,379 |
| 2015 | $57 | $541 | $541 | $0 |
| 2014 | $57 | $541 | $541 | $0 |
Source: Public Records
Map
Nearby Homes
- 401 Idabel Bridge Cir
- 4900 Pont Neuf Rd
- 617 Idabel Bridge Cir
- 4808 Pont Neuf Rd
- 609 Newport Bridge Dr
- 209 Pont de Normandie Ct
- 216 Pont Neuf Ct
- 201 Pont Neuf Ct
- 101 Pont Neuf Ct
- 701 Tacoma Bridge Ct
- 5301 Arch Bridge Ct
- 4600 Caliburn Pkwy
- 1117 Falls Bridge Ct
- The Cornerstone Half Bath Plan at Wild Rose Ranch
- The Mallory Plus Plan at Wild Rose Ranch
- The Shiloh Plus Plan at Wild Rose Ranch
- The Shiloh Half Bath Plus Plan at Wild Rose Ranch
- The Blue Spruce Half Bath Plus Plan at Wild Rose Ranch
- The Blue Spruce Bonus Room 1 Plan at Wild Rose Ranch
- The Sage Bonus Room 1 Plan at Wild Rose Ranch
- 4901 Fremont Bridge Ct
- 409 Idabel Bridge Cir
- 4908 Fremont Bridge Ct
- 417 Idabel Bridge Cir
- 317 Idabel Bridge Cir
- 4916 Fremont Bridge Ct
- 4909 Fremont Bridge Ct
- 309 Idabel Bridge Cir
- 4917 Fremont Bridge Ct
- 4924 Fremont Bridge Ct
- 400 Idabel Bridge Cir
- 4817 Coronado Bridge Ct
- 408 Idabel Bridge Cir
- 316 Idabel Bridge Cir
- 4909 Coronado Bridge Ct
- 4925 Fremont Bridge Ct
- 416 Idabel Bridge Cir
- 308 Idabel Bridge Cir
- 424 Idabel Bridge Cir
- 4933 Fremont Bridge Ct