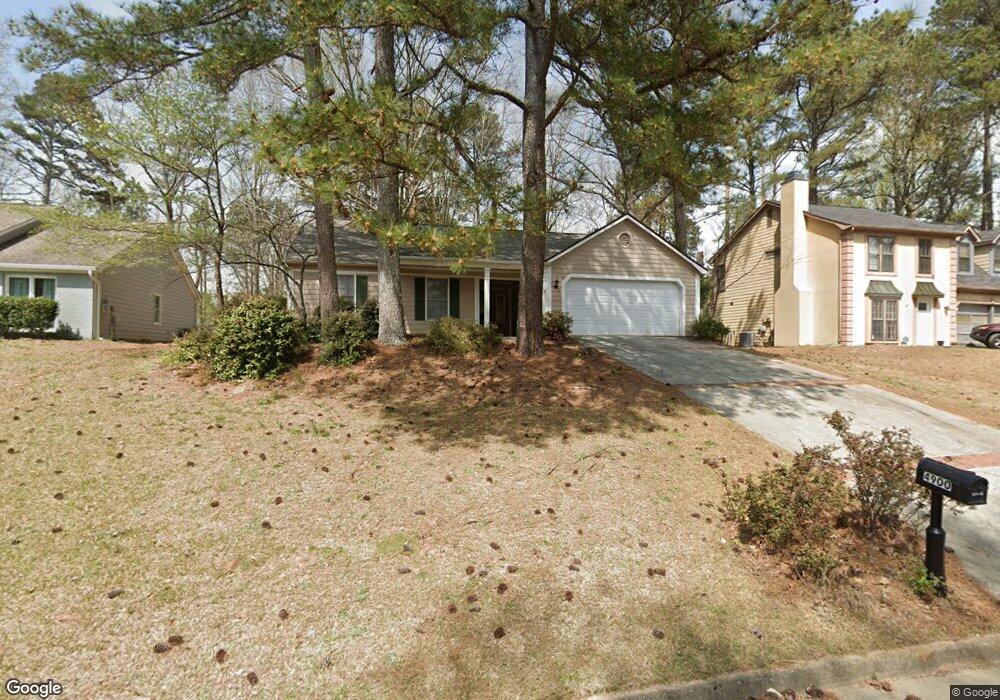
4900 Hampton Square Dr Alpharetta, GA 30022
Estimated Value: $442,000 - $528,000
3
Beds
2
Baths
1,431
Sq Ft
$332/Sq Ft
Est. Value
About This Home
This home is located at 4900 Hampton Square Dr, Alpharetta, GA 30022 and is currently estimated at $475,193, approximately $332 per square foot. 4900 Hampton Square Dr is a home located in Fulton County with nearby schools including Ocee Elementary School, Taylor Road Middle School, and Chattahoochee High School.
Ownership History
Date
Name
Owned For
Owner Type
Purchase Details
Closed on
Dec 17, 2010
Sold by
Reed David J
Bought by
Sequoia Capital Llc
Current Estimated Value
Purchase Details
Closed on
Dec 19, 2001
Sold by
Reed Deborah L B
Bought by
Reed David J
Home Financials for this Owner
Home Financials are based on the most recent Mortgage that was taken out on this home.
Original Mortgage
$129,600
Interest Rate
6.42%
Mortgage Type
New Conventional
Purchase Details
Closed on
Jul 9, 2001
Sold by
Laponzina Steven
Bought by
Reed Deborah
Purchase Details
Closed on
Apr 15, 1993
Sold by
Gottschalk Sandra J
Bought by
Garcia Michael A
Home Financials for this Owner
Home Financials are based on the most recent Mortgage that was taken out on this home.
Original Mortgage
$86,650
Interest Rate
9.5%
Mortgage Type
FHA
Create a Home Valuation Report for This Property
The Home Valuation Report is an in-depth analysis detailing your home's value as well as a comparison with similar homes in the area
Purchase History
| Date | Buyer | Sale Price | Title Company |
|---|---|---|---|
| Sequoia Capital Llc | -- | -- | |
| Reed David J | -- | -- | |
| Reed Deborah | $115,000 | -- | |
| Garcia Michael A | $10,100 | -- |
Source: Public Records
Mortgage History
| Date | Status | Borrower | Loan Amount |
|---|---|---|---|
| Previous Owner | Reed David J | $129,600 | |
| Previous Owner | Garcia Michael A | $86,650 | |
| Closed | Garcia Michael A | $15,700 |
Source: Public Records
Tax History
| Year | Tax Paid | Tax Assessment Tax Assessment Total Assessment is a certain percentage of the fair market value that is determined by local assessors to be the total taxable value of land and additions on the property. | Land | Improvement |
|---|---|---|---|---|
| 2025 | $4,508 | $177,640 | $50,240 | $127,400 |
| 2023 | $4,150 | $147,040 | $44,640 | $102,400 |
| 2022 | $3,796 | $123,720 | $27,160 | $96,560 |
| 2021 | $2,728 | $102,040 | $26,840 | $75,200 |
| 2020 | $3,111 | $96,640 | $23,560 | $73,080 |
| 2019 | $374 | $94,920 | $23,160 | $71,760 |
| 2018 | $2,757 | $84,640 | $21,120 | $63,520 |
| 2017 | $2,216 | $65,120 | $14,400 | $50,720 |
| 2016 | $2,184 | $65,120 | $14,400 | $50,720 |
| 2015 | $2,209 | $65,120 | $14,400 | $50,720 |
| 2014 | $2,206 | $62,560 | $14,280 | $48,280 |
Source: Public Records
Map
Nearby Homes
- 4905 Weathervane Dr
- 4945 Weathervane Dr
- 680 Kimball Parc Way
- 4655 Hampton Square Dr
- 4790 Roswell Mill Dr
- 4775 Roswell Mill Dr Unit 2
- 4750 Jones Bridge Woods Dr
- 11686 Davenport Ln
- 11619 Davenport Ln
- 4960 Agate Dr
- 10035 Blanford Way
- 4740 Carversham Way
- 4718 Lakeway Place
- 11395 Brookhollow Trail
- 122 Prospect Place
- 110 Prospect Place
- 115 Arborfield Way
- 11285 Vedrines Dr
- 5265 N Hillbrooke Trace
- 10205 Jones Bridge Rd
- 4890 Hampton Square Dr Unit DR
- 4890 Hampton Square Dr
- 4890 Hampton Square Dr Unit 4890
- 4910 Hampton Square Dr
- 4905 Hampton Square Dr
- 4550 Weathervane Dr
- 4870 Hampton Square Dr
- 4540 Weathervane Dr
- 4895 Hampton Square Dr
- 4885 Hampton Square Dr
- 4860 Hampton Square Dr
- 4530 Weathervane Dr
- 4875 Hampton Square Dr
- 11410 Frazier Fir Ln
- 11420 Frazier Fir Ln Unit 2
- 315 Frazier Fir Ct Unit 2
- 4570 Weathervane Dr
- 4850 Hampton Square Dr
- 4520 Weathervane Dr
- 11430 Frazier Fir Ln
Your Personal Tour Guide
Ask me questions while you tour the home.